Science Experiment PPT Template – Meaningful Visual Communication
J0400009
- Last Update 01/07/2025
- File Size 9.1MB
- # of Slides 35
- File Format PPTX
- Slide Ratio 16:9
- Color
Slide Preview


Keywords
About the Product
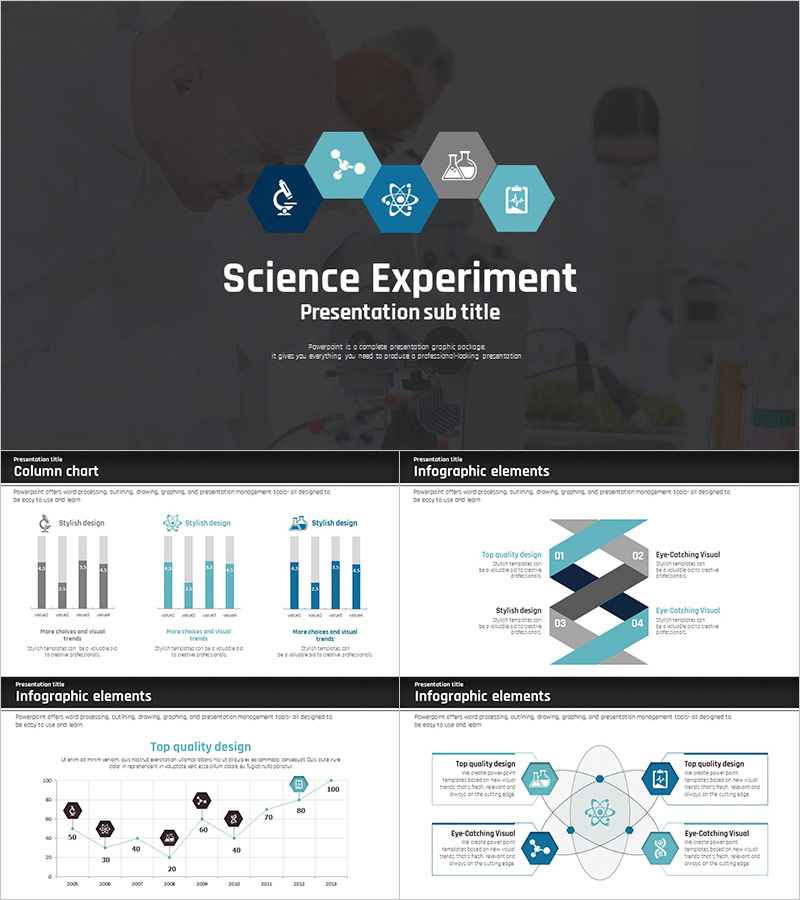
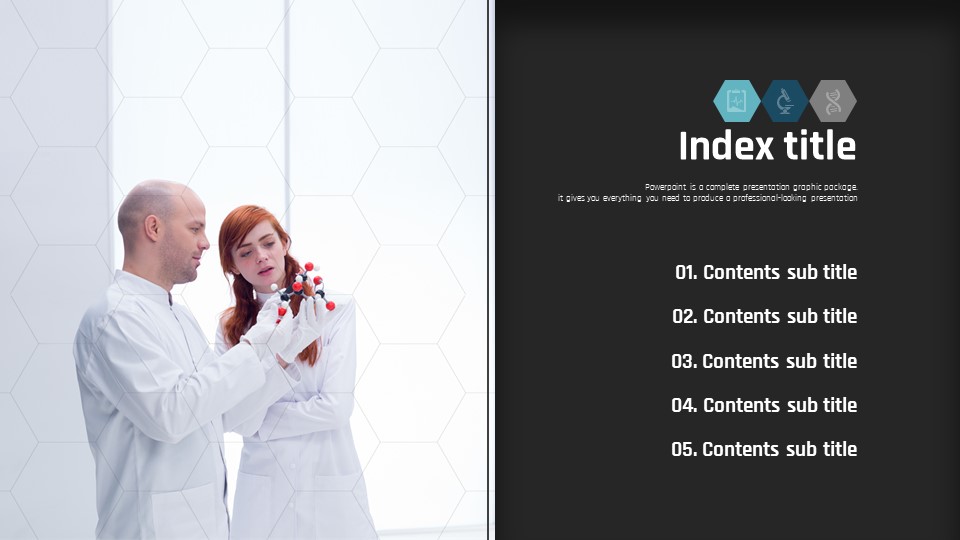
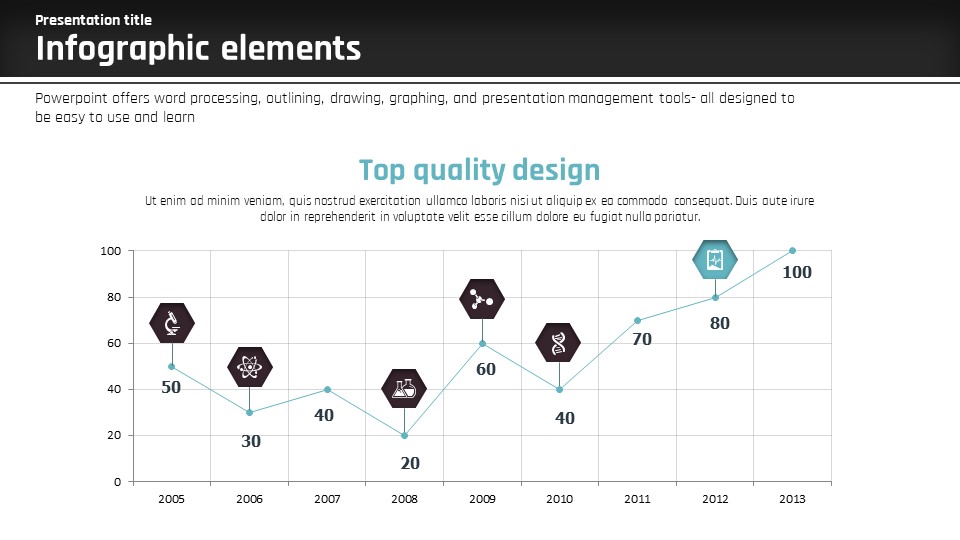
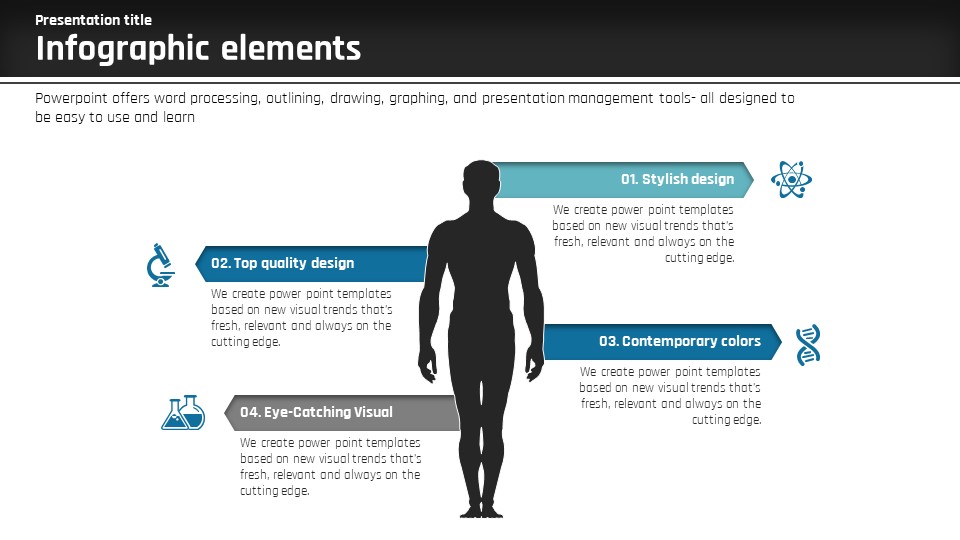
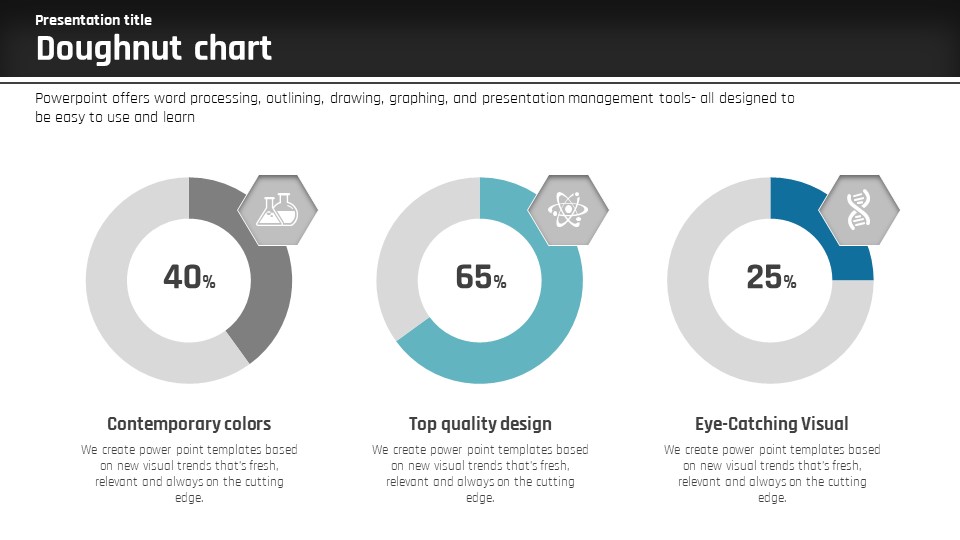
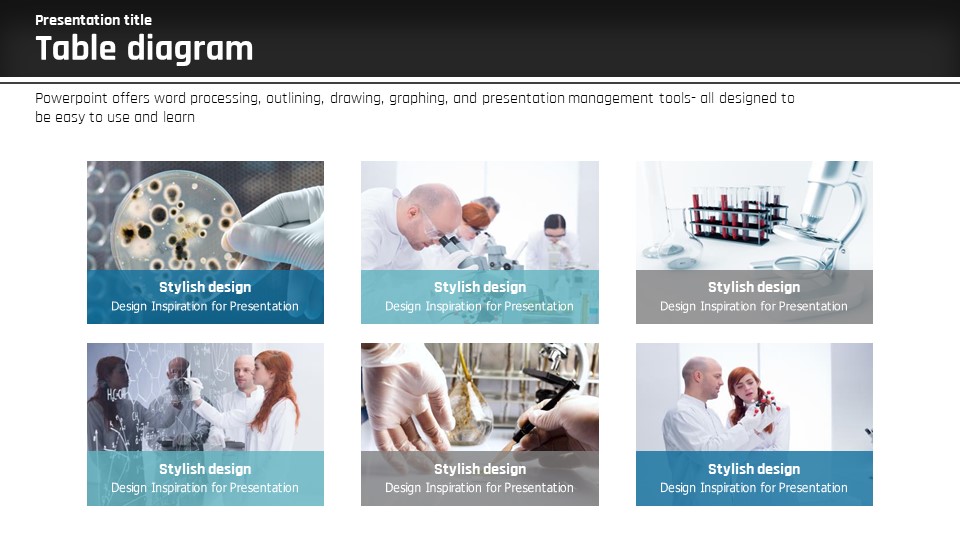
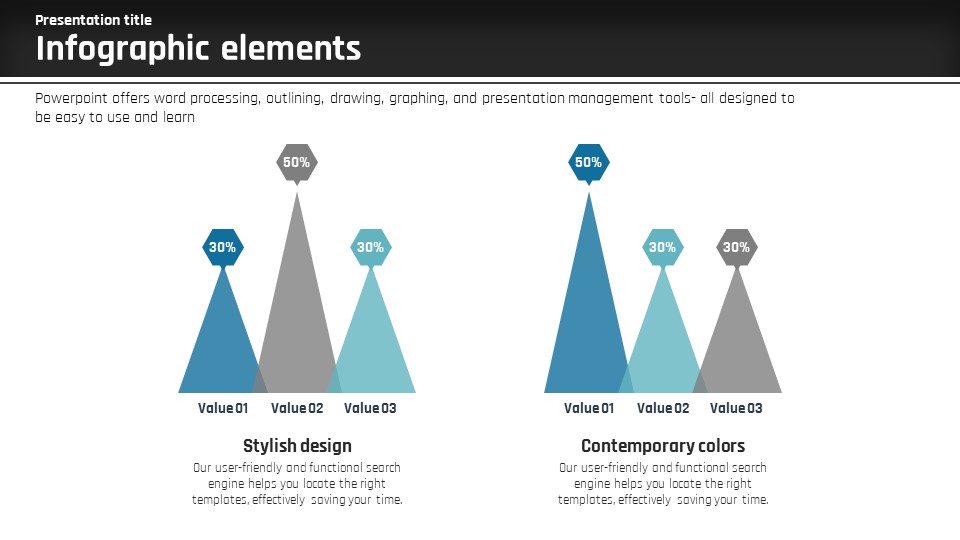
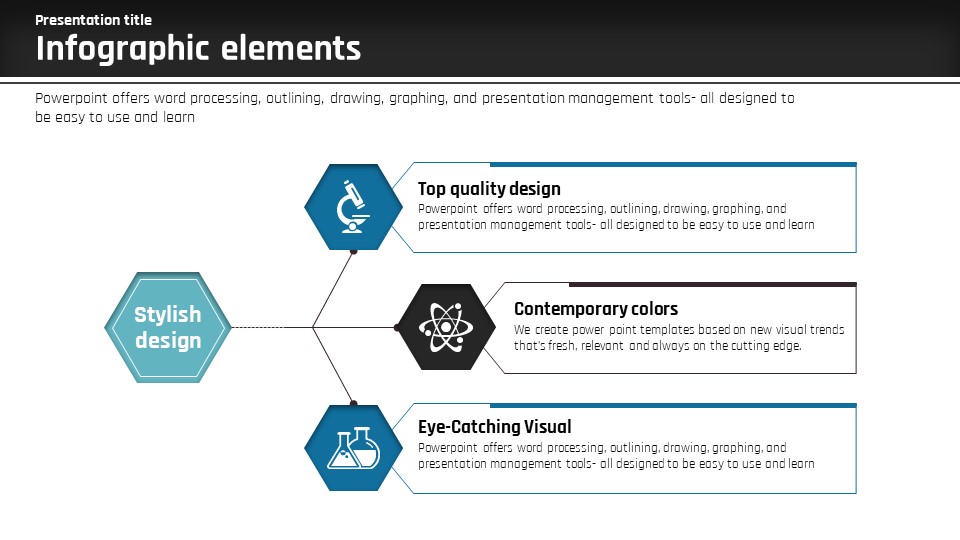
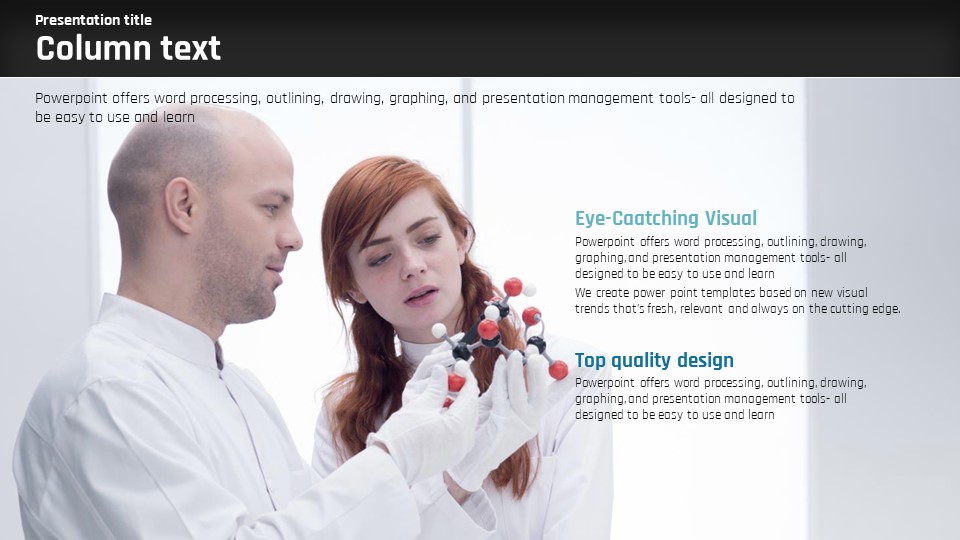
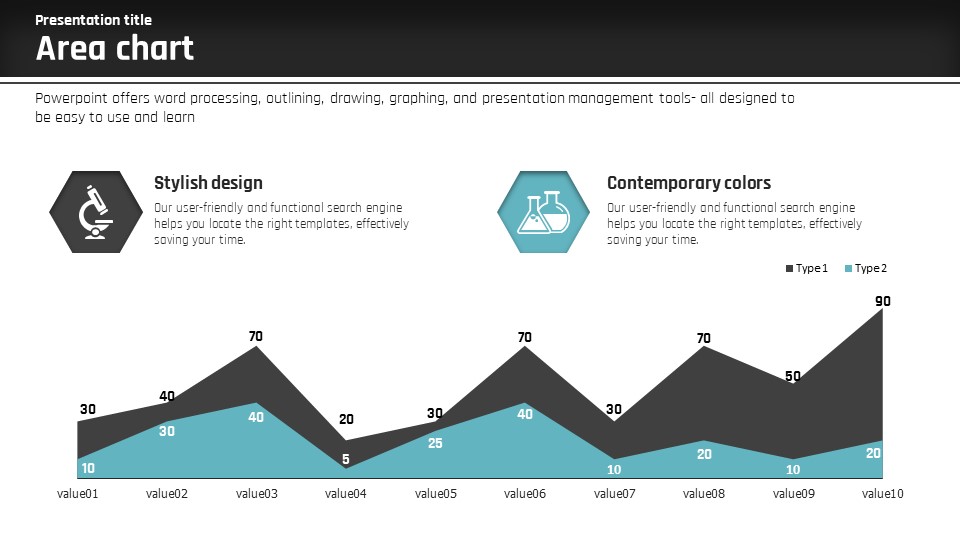
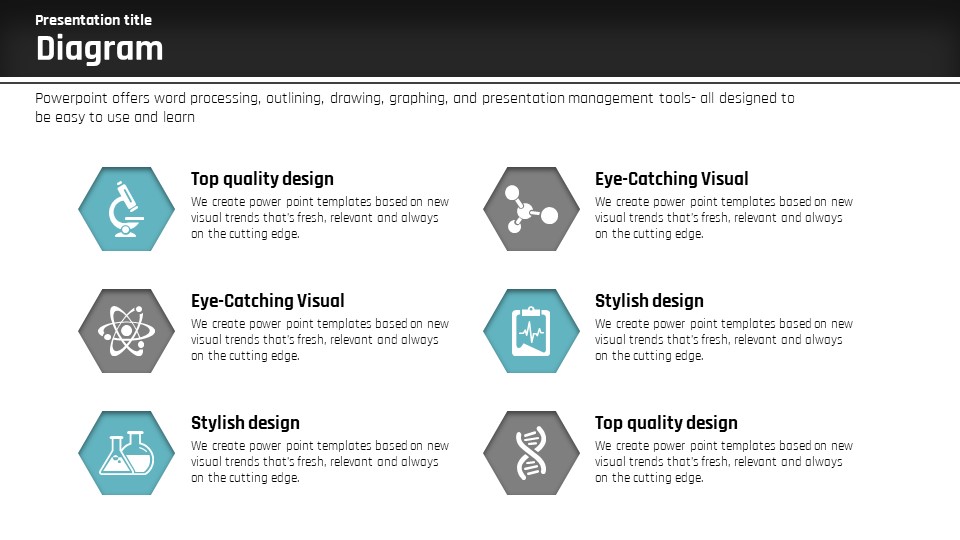
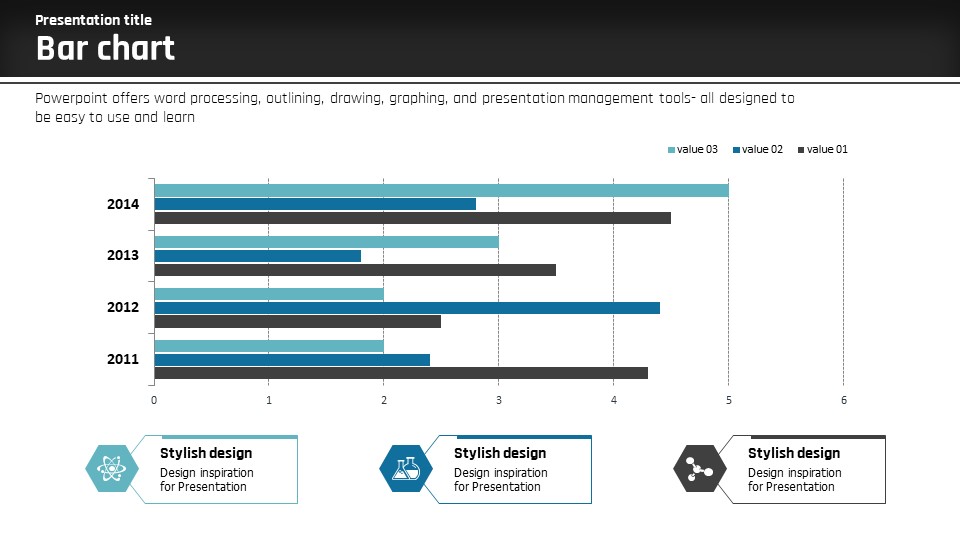
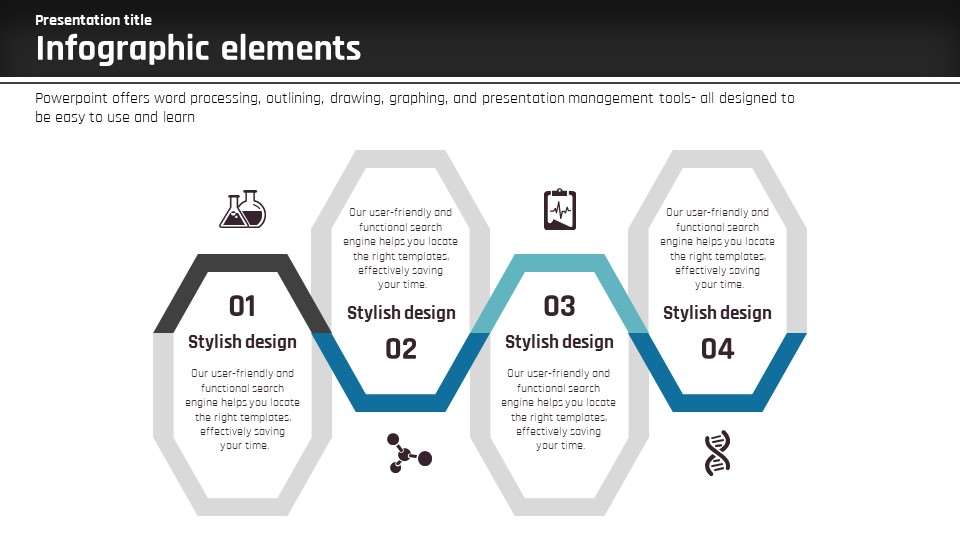
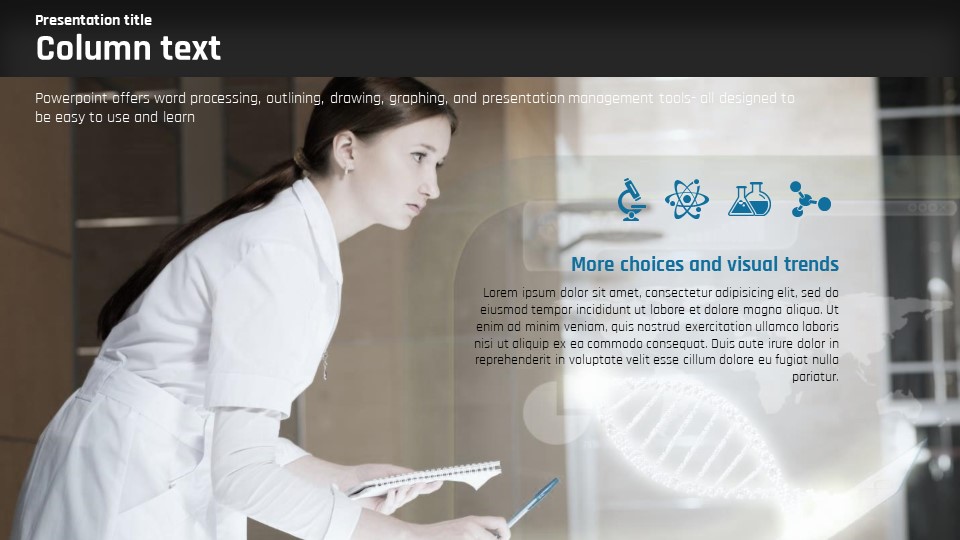
A professional science and research PowerPoint template combining laboratory background photography with dark charcoal, navy blue, and teal hexagon icon layouts. This 35-slide presentation deck covers the full range of scientific communication needs, including title slides, column charts, test tube percentage infographics, and hexagon process diagrams. Science icons — microscope, atom, beaker, and molecular structure — are embedded within hexagon shapes to deliver research data and experimental results with visual clarity. The dark-toned slides create a credible, academic atmosphere ideal for university research presentations, lab reports, and science education materials. All elements in this PowerPoint template are fully editable in PPTX format, allowing you to update text, numerical data, and colors to match your actual research content. Whether you are presenting at a conference, submitting a lab report, or teaching a science class, this slide set provides a structured and visually consistent framework for your presentation.
Usage Points
-
Main Usage
Designed for presenting scientific experiment results, visualizing research data, and creating academic seminar or science classroom materials. The dark charcoal background with teal and navy hexagon icons establishes a professional, research-oriented atmosphere throughout the presentation.
-
How to Use
Open the PPTX file and replace the placeholder text, numerical values, and colors with your actual research content. Update the test tube percentage figures, column chart data, and hexagon process steps to reflect your experimental findings and methodology.
-
Recommended For
Ideal for graduate students and researchers presenting academic findings, science teachers preparing classroom slides, pharmaceutical and biotech companies reporting research outcomes, and science institutions creating professional presentation materials.
-
Slide Structure
The 35-slide set includes a title slide with laboratory background and five hexagon science icons, column chart slides with three-bar layouts, a diamond-shaped four-section infographic, a five-unit test tube percentage infographic, and a four-step hexagon process diagram.
Related Products
-

Medical Presentation Template for Surgery – Professional and Sleek Design
#Science/Medical
-

New Drug Introduction Presentation Template – Scientific and Stylish Design
#Science/Medical
-

Chemistry Lab Presentation Template - Eye-Catching Visual Design
#Science/Medical
-

Plastic Surgery Presentation Template – Professional Visual Representation
#Science/Medical
