Science Business Area Slides – Stylish Data Visualization
RJ0400009_24
- Last Update 05/19/2025
- File Size 0.3MB
- # of Slides 2
- File Format PPTX
- Slide Ratio 16:9
- Color
Keywords
About the Product
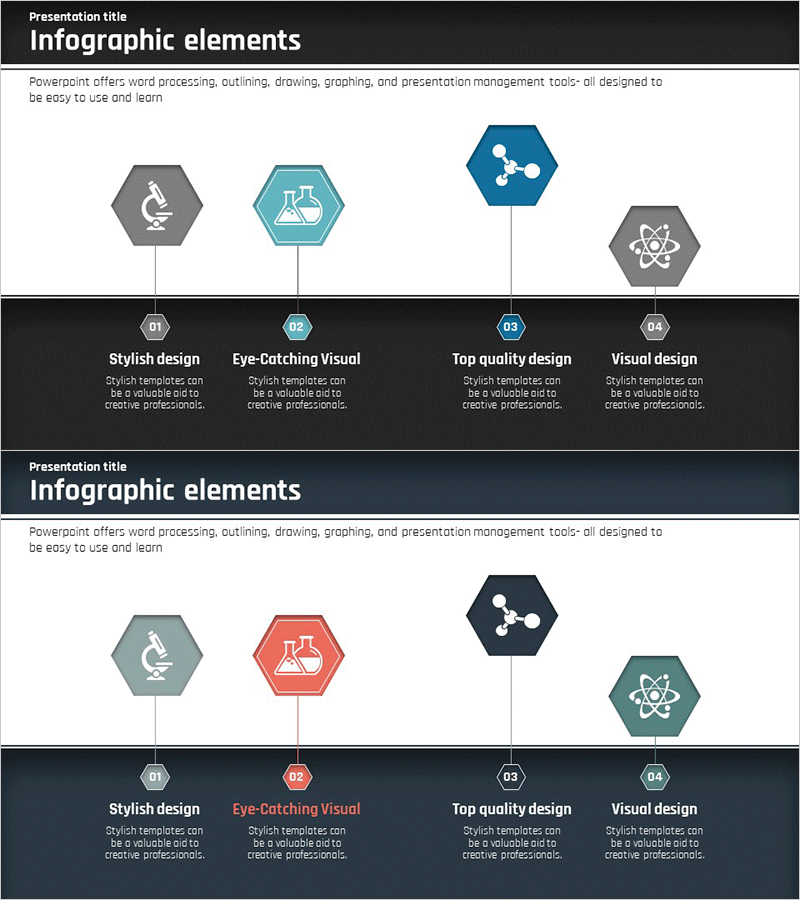
A professional hexagon icon infographic PowerPoint slide optimized for science, technology, and R&D presentations. Features four science-related icons (microscope, lab equipment, molecule, atom) arranged in hexagonal frames with dedicated text areas for descriptions. The dark background combined with gray and blue hexagon tones conveys expertise and credibility, making it ideal for data visualization and information structuring. The 2-slide set includes color variations (gray, blue, and red tones) for immediate use in technology presentations, research reports, business field introductions, and technical demonstrations.
Usage Points
-
Main Usage
Visually compare and explain four key elements in science, technology, or R&D fields. The hexagon frames and icons create information hierarchy, while text areas below each icon provide detailed descriptions. Effectively emphasizes technical credibility and professional expertise.
-
How to Use
Use in technology presentations, research reports, business field overviews, or product feature explanations when listing and comparing four core elements. Simply enter item names and descriptions in the text areas below each hexagon icon. The dark background ensures excellent readability in projector environments.
-
Recommended For
Ideal for technology presenters, technical planners, product marketing professionals, and academic speakers. Particularly effective for B2B presentations emphasizing technical credibility, investor technology briefings, academic seminars, and R&D project showcases.
-
Slide Structure
Each slide features a title area at the top and four hexagon icon sections below. Each hexagon contains an icon (microscope, lab equipment, molecule, atom), number, item name, and four lines of description text. Both slides share identical structure with color variations (gray, blue, and red tones).
Related Products
-

Internet of Things Service Area Diagram – Business Introduction and Visualization
#Company Introduction #Business Introduction #Diagram
-

Introduction to Gaming Device Types Slide - Visual Appeal and Contemporary Colors
#Company Introduction #Product/Service Introduction #Diagram
-

Effective Presentation with VR Product Configuration Diagram
#Company Introduction #Technical Approach #Diagram
-

Big Data Analysis Area Diagram
#Company Introduction #Business Introduction #Diagram
