Diffusion Diagram of Science Business Areas – Innovation and Integration
RJ0400009_26
- Last Update 05/19/2025
- File Size 0.3MB
- # of Slides 2
- File Format PPTX
- Slide Ratio 16:9
- Color
Keywords
- #Content-Based Slides
- #Design-Based Slides
- #Company Introduction
- #Business Introduction
- #Diagram
- #Business Areas
- #Technological Status
- #Spread
- #Centralized Diagram
- #16:9
- #radial diagram PowerPoint
- #diffusion diagram slide template
- #central network diagram
- #science technology PPT slide
- #business area diagram PowerPoint download
About the Product
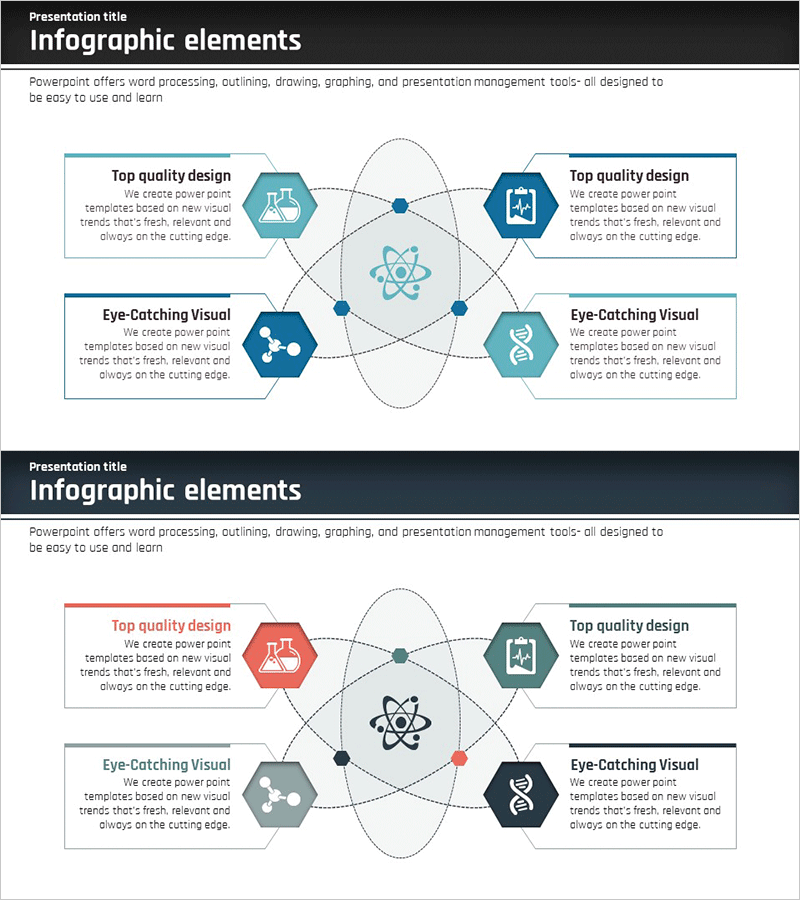
A radial diffusion diagram PowerPoint slide where the central concept branches into four directions with hexagon icons representing science, technology, innovation, and integration. Teal and navy blue color schemes with dotted connection lines and nodes visualize interconnected relationships. This 2-slide presentation template is ready to use for business area introductions, technology landscape analysis, and corporate vision presentations. Available in 16:9 widescreen PPTX format, fully editable in all PowerPoint versions.
Usage Points
-
Main Usage
Visualize the relationship between a core business concept and surrounding domains using a radial structure. The central circular node branches into four directions with dotted connectors and hexagon icons, intuitively conveying diffusion, connection, and integration concepts. Abstract ideas like science, technology, innovation, and integration are categorized into concrete domains, enhancing audience comprehension.
-
How to Use
Use in company overview slides to explain business areas and technology landscape. Enter the main topic (e.g., technology innovation, business integration) in the central text box and add details in the four hexagon areas. Colors and icons can remain as designed or be customized to match your company brand guidelines.
-
Recommended For
Ideal for science, technology, and IT industry business plans, technology landscape reports, and corporate vision presentations. Effective for executive, investor, and employee audiences explaining complex business structures clearly and concisely. Applicable to new business planning, technology roadmaps, organizational role distribution, and similar contexts.
-
Slide Structure
2-slide set with teal color scheme on the first slide and multi-color (navy, gray, black) on the second. Each slide features 1 central circular node and 4 hexagon icons in four directions (4 nodes total), connected by dotted lines forming a 5-node radial structure. Four text boxes positioned beside each hexagon provide input areas for descriptions.
Related Products
-

Medical Business Sector Diffusion Diagram - Clarifying Business Structure
#Company Introduction #Business Introduction #Diagram
-

Learning Subject Diffusion Diagram - Visualizing Connections of Information
#Company Introduction #Business Introduction #Diagram
-

Science Business Area Diffusion Diagram – Connecting the Future of Business
#Company Introduction #Business Introduction #Diagram
-

Pill Ingredient Analysis Diagram – Effective Visualization for Business Introduction
#Company Introduction #Business Introduction #Diagram
