Science Business Goals Connection Diagram – Presenting Business Vision and Strategy
RJ0400009_30
- Last Update 05/19/2025
- File Size 0.3MB
- # of Slides 2
- File Format PPTX
- Slide Ratio 16:9
- Color
Keywords
About the Product
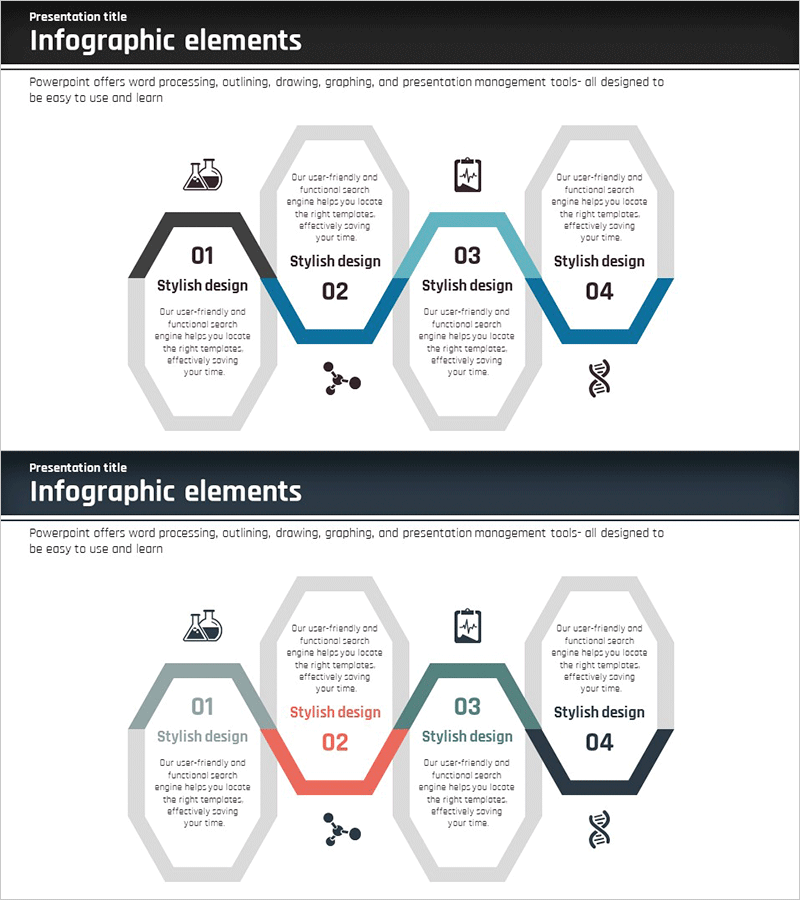
A hexagon connection diagram PowerPoint slide that visually links business objectives and strategies. Four hexagon nodes are arranged around a central connecting element, each providing independent text areas and icon spaces. Set against a dark background with gray, blue, and turquoise hexagons arranged hierarchically, this design is ideal for business presentations, organizational structure explanations, and project goal mapping. The 2-slide set is ready to edit and can be immediately applied to presentations, planning documents, and reports.
Usage Points
-
Main Usage
Visualizes relationships and connections between four key elements such as business objectives, strategies, core values, and execution plans. Each hexagon node can display text and icons to hierarchically represent organizational vision, mission, goals, and strategies.
-
How to Use
Enter business objective names in each hexagon node's text box and insert representative icons in the icon areas. The central connecting element can remain fixed or be modified to emphasize relationships between nodes. Colors can be differentiated by objective or unified for consistency.
-
Recommended For
Recommended for executives, planning teams, and strategy managers presenting business goal linkage diagrams; for new employee orientation and organizational introduction sessions explaining company vision and strategy relationships; and for investor presentations emphasizing business objective integration.
-
Slide Structure
2-slide set. Each slide features 4 hexagon nodes (top-left, top-right, bottom-left, bottom-right) and a central connecting element. The first slide uses blue and turquoise tones; the second provides color variations with gray, red, and black tones. 16:9 widescreen format, PPTX file type compatible with all PowerPoint versions for easy editing.
Related Products
-

Timeline of Core Technology Development – Vision and Strategy
#Company Introduction #Business Vision and Strategy #Diagram
-

Medical Strategy Goals Diagram – Vision and Practice
#Business Vision and Strategy #Marketing Plan and Strategy #Diagram
-

Art Education Goal Structure – Effective Strategy Development
#Business Vision and Strategy #Marketing Plan and Strategy #Diagram
-

Geometry Wide PPT Diagram – Business Strategy and Goals
#Business Vision and Strategy #Diagram #Business Strategy
