Business Area Connection Diagram – Efficient Organization of Business Domains
RJ0400009_12
- Last Update 05/19/2025
- File Size 0.3MB
- # of Slides 2
- File Format PPTX
- Slide Ratio 16:9
- Color
Keywords
About the Product
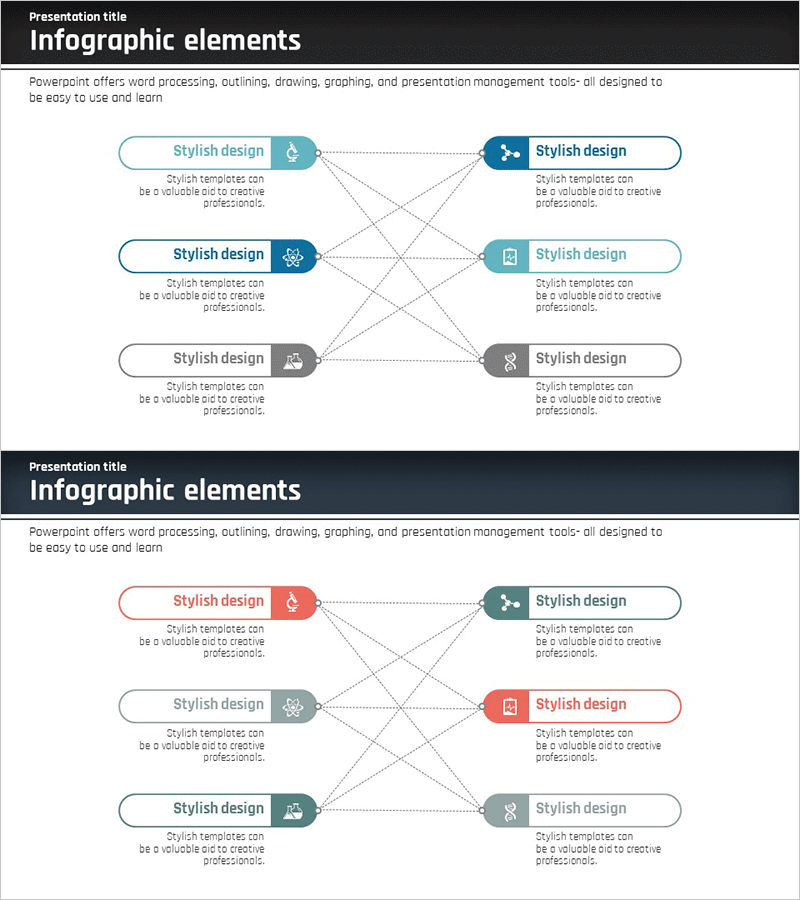
A multi-directional connection diagram PowerPoint slide that visualizes complex relationships between business areas and organizational domains. Six nodes arranged symmetrically on left and right sides are connected by cross-linking dotted arrows, using teal, blue, and gray icon circles paired with oval text boxes. Each node represents an independent element, and the multiple connection lines effectively convey network structures, collaboration relationships, and mutual influence. Two slide variations provide color options (teal-blue-gray and red-teal-gray) for flexible presentation contexts.
Usage Points
-
Main Usage
Clearly expresses mutual relationships and collaboration structures between business areas, departments, and teams. Visually communicates network effects, mutual influence, and integrated strategies to emphasize organizational connectivity and synergy.
-
How to Use
Use in company overview, organizational structure, business area explanation, and strategy presentation slides to represent inter-departmental and cross-business relationships. Edit node text to input actual area or team names, and select color variations to match presentation tone.
-
Recommended For
Ideal for executive, strategy team, and organizational development presentations on organizational structure and business portfolio. Effectively simplifies complex relationships in consulting proposals, business plans, and organizational restructuring presentations.
-
Slide Structure
Three nodes on the left (oval text boxes with circular icons) and three on the right arranged symmetrically, connected by dotted arrows crossing the center to express multiple relationships. Two-slide set with color palette variations (teal-blue-gray and red-teal-gray).
Related Products
-

Multidirectional Diagram for Business Field Description – Intuitive Flow
#Company Introduction #Diagram #Business Areas
-

AI Service Main Business Areas – Vision of Innovation and Growth
#Company Introduction #Business Vision and Strategy #Diagram
-

Aerospace Industry Closure Diagram – Effective Business Explanation
#Company Introduction #Product/Service Introduction #Diagram
-

Aerospace Industry Development Area Diagram
#Company Introduction #Business Introduction #Diagram
