Beaker Shaped Vertical Bar Graph – Visualization for Market Analysis
RJ0400009_10
- Last Update 05/19/2025
- File Size 0.3MB
- # of Slides 2
- File Format PPTX
- Slide Ratio 16:9
- Color
Keywords
About the Product
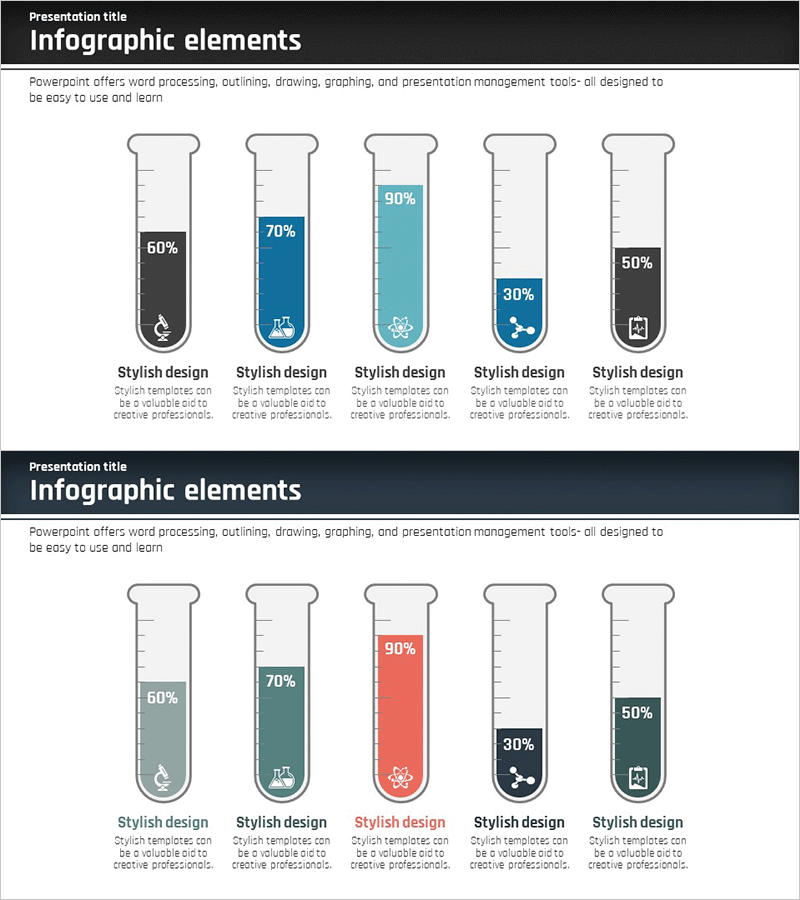
A specialized vertical bar graph PowerPoint slide designed for market analysis and data comparison using beaker-shaped columns. The slide features five independent beaker-form bars displaying different percentages (60%, 70%, 90%, 30%, 50%) with measurement scales at the top and category icons at the bottom. This presentation template is available in multiple color combinations including navy, dark gray, teal, and charcoal, making it ideal for corporate presentations, marketing analysis reports, and sales performance reviews. The intuitive beaker design helps audiences quickly understand comparative data across different categories or metrics.
Usage Points
-
Main Usage
Visualizes numerical comparisons and percentage data across five distinct categories using a unique beaker-shaped column design. Particularly effective for scientific, medical, or chemical research presentations, while also serving general business data comparison needs in marketing and sales contexts.
-
How to Use
Modify the height and color of each beaker column to input your actual data values. Update the bottom icons and text labels to reflect your specific categories. Adjust percentage numbers as needed and select the color combination that best matches your presentation theme or corporate branding.
-
Recommended For
Marketing professionals, data analysts, and sales teams presenting performance metrics. Ideal for market research findings, product sales comparisons, customer satisfaction surveys, experimental data analysis, and any presentation requiring clear quantitative information visualization.
-
Slide Structure
Two-slide set featuring five beaker-shaped vertical bars per slide. First slide uses navy, dark gray, and teal color scheme; second slide offers gray, teal, red, and charcoal combinations. Each bar includes measurement scale markings and category icons for flexible customization.
Related Products
-

Real Estate Sales and Consumer Analysis Slide
#Market and Competitor Analysis #Graph #Market Status
-

Weather Change Vertical Bar Graph Analysis - Understanding Market Status
#Market and Competitor Analysis #Graph #Market Status
-

3D Vertical Graph Market Status – Premium Template for Market Analysis
#Business Introduction #Market and Competitor Analysis #Graph
-

Market Status Graph Blue Bluegreen – Horizontal Bar Chart Template for Visualizing Market Trends
#Market and Competitor Analysis #Graph #Market Status
