Business Area Connection Diagram
RJ0400009_7
- Last Update 05/19/2025
- File Size 0.3MB
- # of Slides 2
- File Format PPTX
- Slide Ratio 16:9
- Color
Keywords
- #Content-Based Slides
- #Design-Based Slides
- #Company Introduction
- #Product/Service Introduction
- #Diagram
- #Business Areas
- #Differentiation Strategy for Products/Services
- #Cluster
- #Chain Diagram
- #16:9
- #connection diagram PowerPoint
- #business area diagram
- #network diagram slide
- #cluster diagram template
- #business relationship PPT
- #3-node diagram slide
About the Product
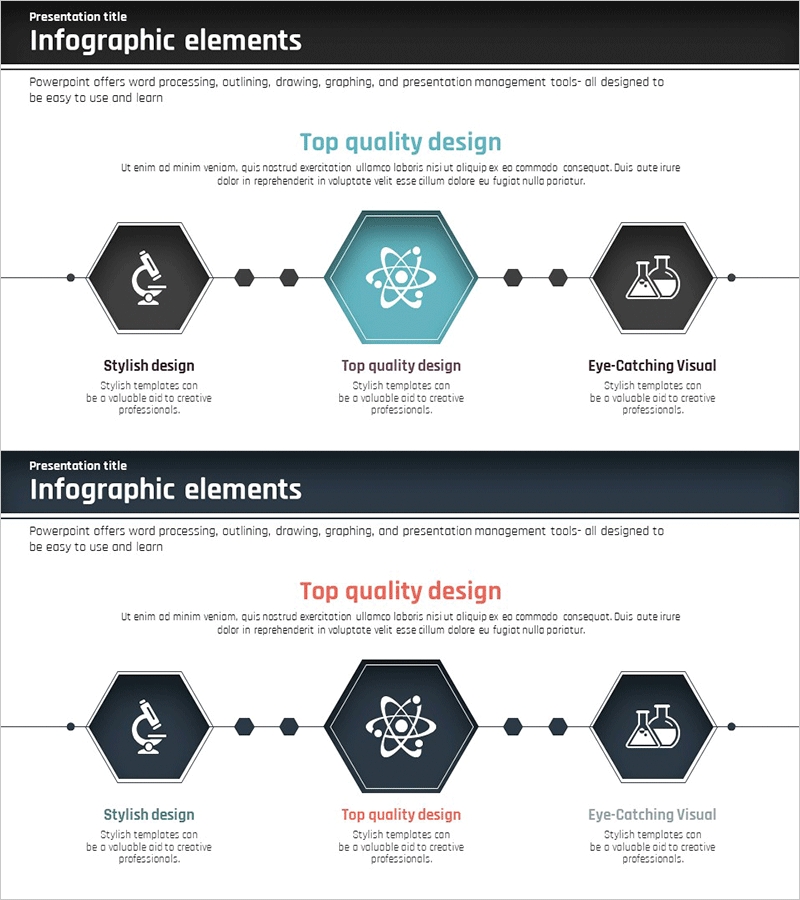
A 3-node connection diagram PowerPoint slide that visualizes relationships between business areas. The design features a central emphasis node in teal hexagon connected to two side nodes in dark gray hexagon through linear connector lines, clearly expressing hierarchical relationships and mutual connections. Each node includes an icon placement area to represent business field characteristics intuitively. This slide is ideal for product and service introduction presentations where you need to explain business synergies and integrated strategies across different domains. The 16:9 widescreen format includes 2 slides ready for immediate editing and customization.
Usage Points
-
Main Usage
Visualize interconnections between business areas and mutual interactions to effectively communicate business integration strategies, product and service portfolio composition, and cross-organizational collaboration frameworks. The central emphasis node highlights the core business area while side nodes represent related fields, creating a hierarchical structure that clearly explains relationships.
-
How to Use
Insert this slide in the business area explanation section of product and service introduction presentations, or use it in company profile documents to emphasize business interconnectivity. Edit the icons and text in each node to reflect actual business field names, and adjust node colors to match corporate brand guidelines for consistent presentation materials.
-
Recommended For
Ideal for product and service introduction presentations, company profiles, business strategy reports, and marketing plans. Particularly suited for executives, marketing teams, strategy teams, and sales teams who need to explain connectivity across diversified business portfolios. Most effective for companies presenting integrated strategies across multiple business domains.
-
Slide Structure
2-slide set featuring a primary layout with teal central node and dark gray side nodes connected by linear lines, plus a variant layout with dark background. Each hexagonal node includes an icon insertion area and text input field below for business field names and descriptions, allowing full customization for specific business contexts.
Related Products
-

Clear Diagram of Genetic Experiment Procedure
#Company Introduction #Product/Service Introduction #Diagram
-

Business Area Water Drop Shape Diagram – Emphasizing Creativity and Clarity
#Company Introduction #Product/Service Introduction #Diagram
-

AI Business Differentiation Strategy – Innovative Flow and Structure
#Company Introduction #Product/Service Introduction #Diagram
-

Renewable Energy Business Sector Diagram
#Company Introduction #Product/Service Introduction #Diagram
