Triangular Vertical Graph for Competitor Analysis
RJ0400009_16
- Last Update 05/19/2025
- File Size 0.3MB
- # of Slides 2
- File Format PPTX
- Slide Ratio 16:9
- Color
Keywords
- #Content-Based Slides
- #Design-Based Slides
- #Market and Competitor Analysis
- #Diagram
- #Graph
- #Other
- #Competitor Analysis
- #Cluster
- #Combination Diagram
- #16:9
- #triangular graph PowerPoint
- #competitor analysis slide
- #vertical chart template
- #market analysis PPT
- #data visualization slide
- #comparison chart PowerPoint template
About the Product
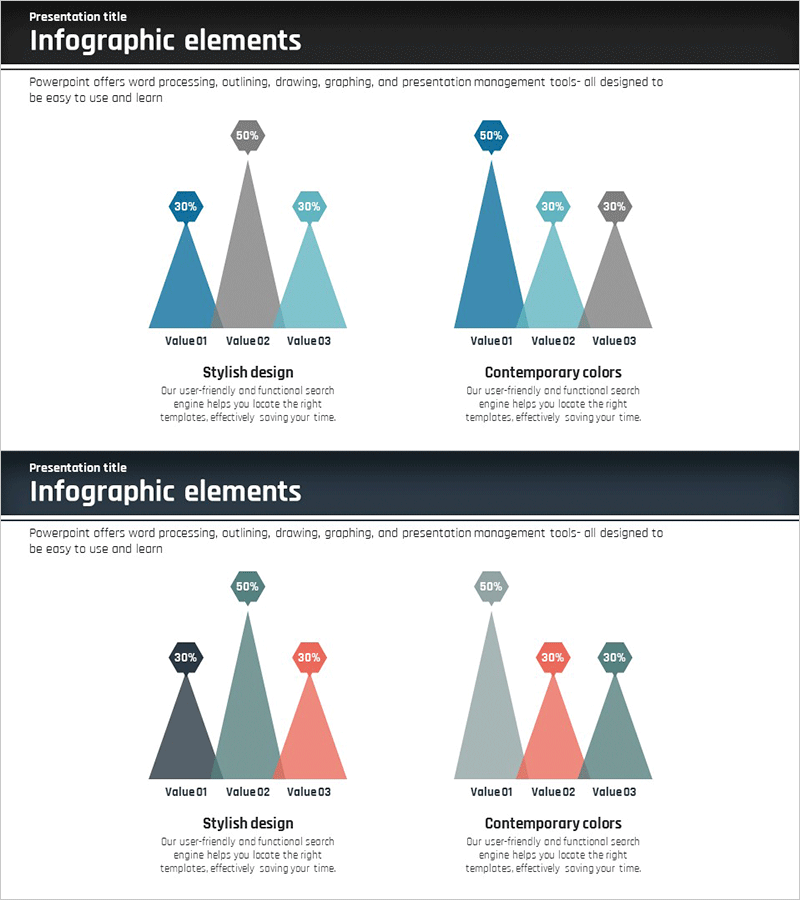
A triangular vertical graph PowerPoint slide designed for competitor analysis and market trend visualization. This presentation template features three comparison items displayed with hexagonal badges, allowing you to evaluate competitive strengths at a glance. The slide deck uses editable shapes compatible with PowerPoint, styled in blue, gray, and light blue tones for a professional appearance. Ideal for strategic planning, marketing proposals, business reports, and data-driven presentations where visual comparison of market positions is essential.
Usage Points
-
Main Usage
Visualize competitor analysis, market trends, and product differentiation through data-driven comparison. The triangular shape's height variation intuitively represents relative value, while hexagonal badges with percentages reinforce quantitative comparison and competitive positioning.
-
How to Use
Replace Value01, Value02, and Value03 labels with competitor names or product categories. Update the percentage values in hexagonal badges with actual data. Adjust triangle heights and colors to emphasize specific competitive advantages, and fill the descriptive text area below with analysis insights.
-
Recommended For
Marketing managers, strategic planners, sales directors, and executives preparing competitive analysis reports. Suitable for business plans, marketing proposals, investor pitch decks, quarterly performance reports, and market positioning presentations.
-
Slide Structure
Two-slide layout: first slide features three triangles in blue, gray, and light blue tones; second slide displays three triangles in gray, light gray, and coral tones. Each triangle includes a hexagonal badge (30–60% values) at the top, value labels at the bottom, and descriptive text areas for analysis commentary.
Related Products
-

PC Mockup & Column Bundle Graph
#Market and Competitor Analysis #Graph #Other
-

Business Program Analysis Area Graph – Competitive Edge
#Market and Competitor Analysis #Diagram #Graph
-

Dividend Analysis Graph for the Last 6 Years – Financial Performance Insights
#Market and Competitor Analysis #Financial Plans and Performance #Graph
-

3D Area Charts and Descriptions – Suitable for Market and Competitor Analysis
#Market and Competitor Analysis #Graph #Other
