Competitor Analysis Vertical Bar Segmentation Graph
RJ0400009_6
- Last Update 05/19/2025
- File Size 0.3MB
- # of Slides 2
- File Format PPTX
- Slide Ratio 16:9
- Color
Keywords
- #Content-Based Slides
- #Design-Based Slides
- #Company Introduction
- #Market and Competitor Analysis
- #Graph
- #Key Achievements
- #Market Analysis
- #Column
- #Segmented Column
- #16:9
- #vertical bar chart PowerPoint
- #segmented bar graph
- #competitor analysis slide
- #data comparison chart
- #market analysis PowerPoint template
About the Product
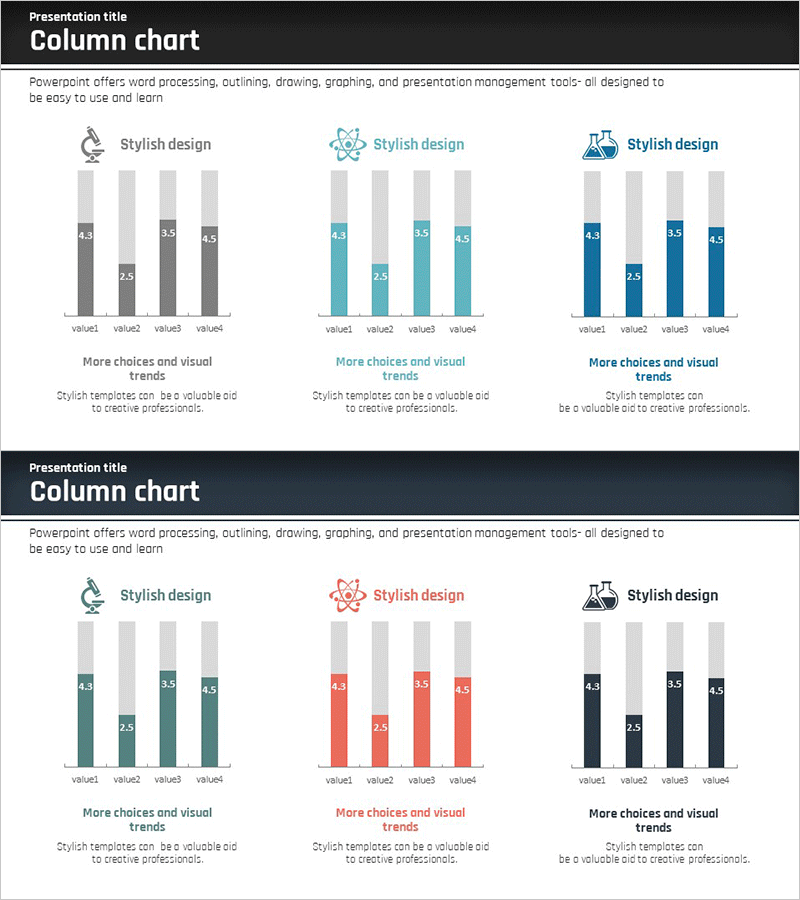
A vertical bar segmentation chart PowerPoint slide optimized for competitor analysis and market comparison. This design displays four data series segmented across each item, enabling simultaneous comparison of multiple metrics. Available in three color combinations—gray, teal, and navy blue—each slide includes input fields for value1 through value4. Ideal for presentations, reports, and strategic documents where competitive positioning, performance measurement, and market share comparison need clear visualization.
Usage Points
-
Main Usage
Visualizes multiple metrics simultaneously for competitor analysis, market comparison, and performance measurement. The vertical segmented bar structure displays both inter-series comparison and aggregate trends, making it ideal for executive briefings, investor presentations, and strategic meetings where competitive positioning must be communicated clearly.
-
How to Use
Enter actual data values into the value1–value4 input fields on each slide; bar heights adjust automatically. Color combinations (gray, teal, navy) can be customized to match presentation themes and brand guidelines. Legend and axis labels are fully editable. The 2-slide format allows multiple comparison items to be presented sequentially.
-
Recommended For
Marketing managers, strategy planners, executives, analysts, and consultants preparing competitive analysis, market research, and performance reports. Commonly used in business plans, investor pitch decks, quarterly performance reports, and marketing strategy documents requiring data-driven decision support.
-
Slide Structure
2-slide set, each containing a 4-series vertical bar segmentation chart (value1–value4). Header includes 'More choices and visual trends' text with icon; description area at bottom. Three color combinations provided (gray, teal, navy) for flexible presentation styling.
Related Products
-

Medical Services Characteristics Connection Diagram
#Market and Competitor Analysis #Graph #Customer Analysis
-

Graph of Changes After a Healthy Diet – Data Visualization Template
#Market and Competitor Analysis #Graph #Market Analysis
-

Customer Analysis Diagram & Segmentation Graph – In-depth Market Insights
#Market and Competitor Analysis #Graph #Customer Analysis
-

Presentation Slide Visualizing Company Performance with Column Chart
#Company Introduction #Market and Competitor Analysis #Diagram
