Business Strategy Connection Diagram – Visualization for Goal Achievement
RJ0400009_19
- Last Update 05/19/2025
- File Size 0.3MB
- # of Slides 2
- File Format PPTX
- Slide Ratio 16:9
- Color
Keywords
- #Content-Based Slides
- #Design-Based Slides
- #Business Vision and Strategy
- #Business Strategy
- #Diagram
- #Business Goals
- #Cluster
- #Chain Diagram
- #Project Progress
- #16:9
- #hexagon diagram PowerPoint
- #cluster connection slide template
- #business goal visualization
- #4-node structure diagram
- #business strategy PowerPoint slide
About the Product
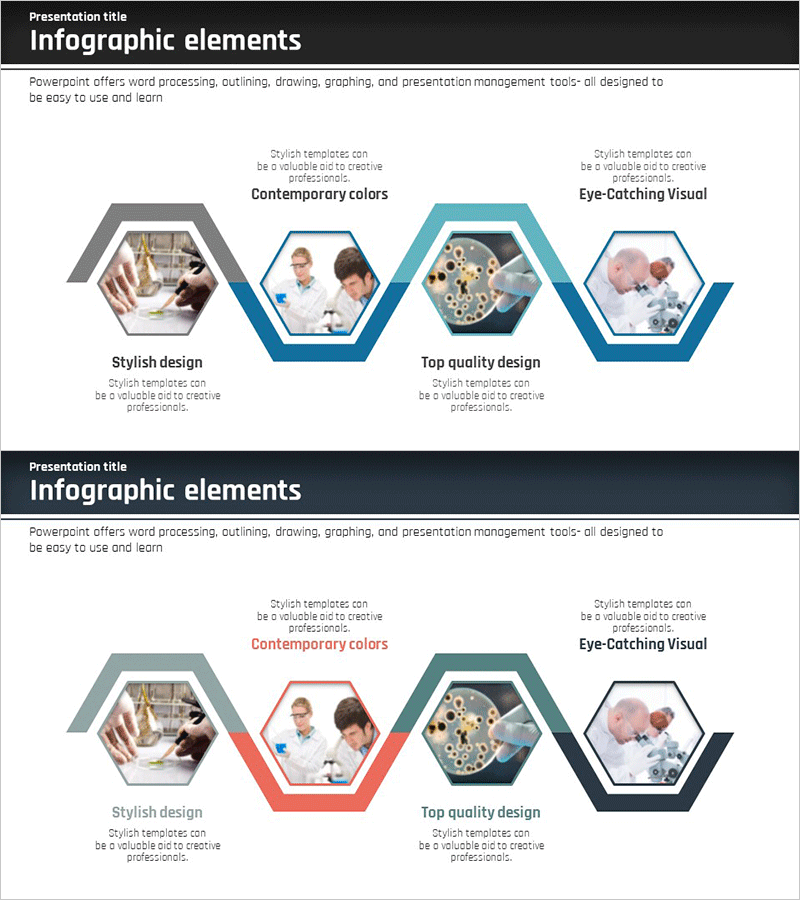
A PowerPoint slide that visualizes business strategy and goal achievement through a hexagon cluster structure. Four hexagon nodes are arranged around a central connection point to intuitively represent mutual relationships and integrated objectives. The multi-color palette—gray, blue, turquoise, and navy—distinguishes each element, while photo images can be inserted into hexagon frames to vividly express team collaboration and project progress. With 2-slide composition, this presentation resource is ready for immediate use across diverse speaking contexts.
Usage Points
-
Main Usage
Categorize core business strategy elements as hexagon nodes and express relationships to integrated goals through a central connection point. Designed to clarify multi-layered relationships such as team collaboration structure, project phase objectives, and cross-departmental strategy alignment at a glance.
-
How to Use
Enter team names, department titles, or goal items in each hexagon node and insert photos to represent team members or project content. Maintain the color tone while editing text and images for use in executive presentations, management reports, and strategy meeting materials.
-
Recommended For
Ideal for executives, project managers, and strategic planning teams explaining business goal achievement pathways. Recommended for quarterly business plan presentations, organizational restructuring explanations, new project kickoff meetings, and investor-facing strategy materials.
-
Slide Structure
2-slide composition. The first slide features four hexagon nodes in gray, blue, turquoise, and navy arranged around a central connection point in a cluster layout, with photo insertion capability in each hexagon. The second slide offers a color-variant layout to accommodate diverse presentation contexts.
Related Products
-

Medical Business Goal Connection Diagram - Business Strategy
#Business Vision and Strategy #Business Strategy #Diagram
-

Medical Business Goals Connection Diagram - Intuitive Representation of Vision and Strategy
#Business Vision and Strategy #Business Strategy #Diagram
-

Journey to a Goal Slide – Emphasizing Business Strategy
#Business Vision and Strategy #Business Strategy #Diagram
-

Blue Pink Business Goals Connection Diagram
#Business Vision and Strategy #Business Strategy #Diagram
