Business Key Performance Table – Effective Performance Analysis
RJ0400009_18
- Last Update 05/19/2025
- File Size 2.1MB
- # of Slides 2
- File Format PPTX
- Slide Ratio 16:9
- Color
Keywords
About the Product
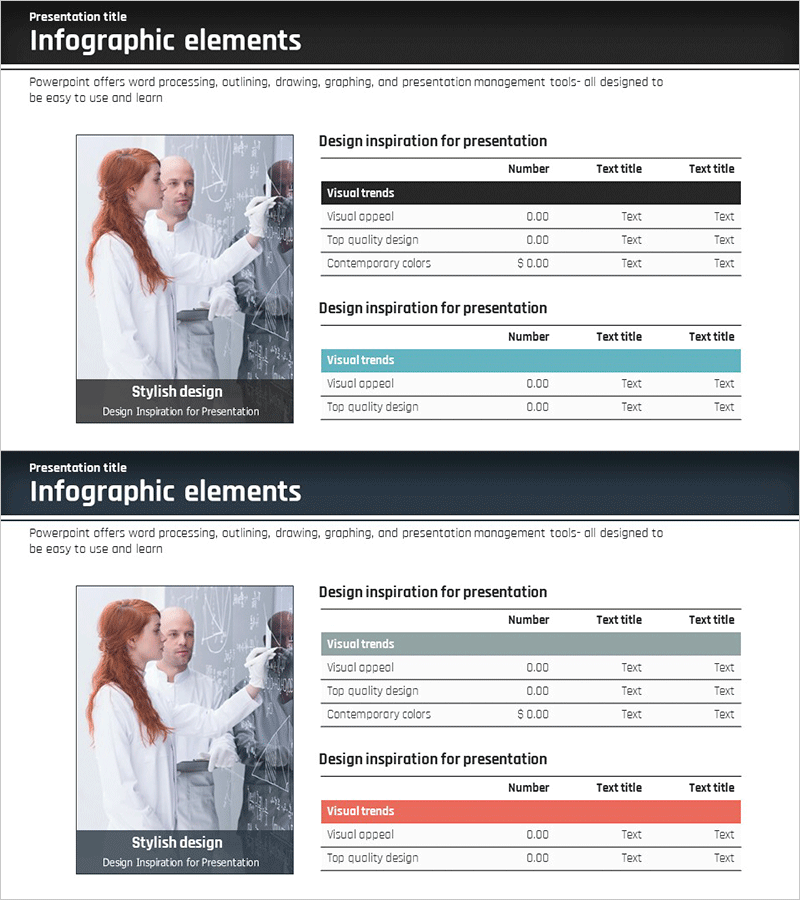
A 2-slide PowerPoint template for visualizing business key performance indicators in a structured table format. Features a horizontal table layout with black header row and white data rows, enabling clear comparison of metrics, targets, and performance outcomes. Delivered in 16:9 widescreen PPTX format for immediate editing and integration into executive presentations, quarterly business reviews, and strategic planning decks. Cells are fully customizable for numerical data, text descriptions, and embedded charts, making it ideal for KPI tracking, goal achievement visualization, and stakeholder communication across finance, operations, and business development teams.
Usage Points
-
Main Usage
Presents organizational key performance indicators (KPIs) in a structured table format for executive stakeholders and decision-makers. Ideal for quarterly performance comparisons, actual vs. target analysis, departmental KPI visualization, and strategic metric tracking across business units.
-
How to Use
Enter performance metric names (revenue, customer satisfaction, market share, etc.) in the header row and corresponding numerical values and descriptions in data rows. Apply color highlighting and conditional formatting to emphasize goal achievement status. Additional rows can be inserted to accommodate more metrics or comparative periods.
-
Recommended For
CFOs, executives, business unit leaders, marketing managers, and project managers presenting quarterly performance reports, board meetings, investor presentations, and strategic business planning sessions requiring clear KPI communication and performance visualization.
-
Slide Structure
Two-slide set featuring a horizontal table with black header row and three white data rows on the first slide, and a teal header row with two white data rows on the second slide. All cells support text, numerical values, and icon insertion for flexible data representation.
Related Products
-

Performance Analysis 3D Bar Chart & Table – Market and Performance Analysis
#Company Introduction #Market and Competitor Analysis #Diagram
-

Award Certification Record Sheet – Achievements and Trust
#Company Introduction #Diagram #Awards and Certifications, and Patents
-

Presentation Slide Visualizing Company Performance with Column Chart
#Company Introduction #Market and Competitor Analysis #Diagram
-

Red-Blue Stereoscopic Pie Charts – Performance Visualization
#Company Introduction #Market and Competitor Analysis #Diagram
