Competitor Analysis Broken Line Graph – Market Insights
RJ0400009_27
- Last Update 05/19/2025
- File Size 1MB
- # of Slides 2
- File Format PPTX
- Slide Ratio 16:9
- Color
Keywords
About the Product
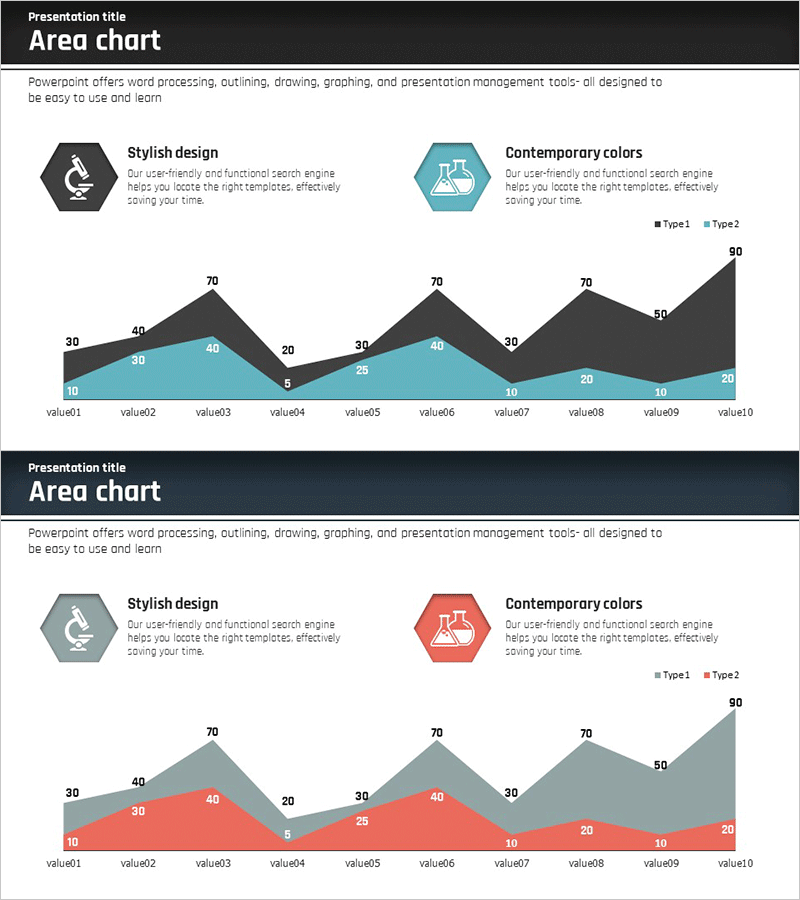
A PowerPoint slide featuring an area chart designed for competitor analysis presentations. Visualizes market share fluctuations across 10 data points for two competitors (Type1 and Type2) using contrasting blue and gray color schemes. Each data segment displays numerical values (5–90) for immediate comprehension. Ideal for strategy reports, investor presentations, and competitive landscape briefings. Delivered in 16:9 widescreen format with 2 slides, fully editable and ready to customize with your own competitive data.
Usage Points
-
Main Usage
Illustrate competitive market dynamics and performance trends over time using stacked area visualization. Enables stakeholders—investors, executives, and team members—to grasp competitive positioning and market insights through data-driven analysis.
-
How to Use
Insert into business plans, marketing strategy documents, or quarterly performance reports within the market analysis section. Replace data points (value01–value10) and series values with actual competitor metrics. Adjust color scheme if needed to match corporate branding.
-
Recommended For
Strategy planners, marketing teams, C-suite executives, and investor relations professionals presenting competitive analysis. Particularly effective for market share trends, competitor performance benchmarking, and industry landscape assessments.
-
Slide Structure
Title header + two icon-labeled description boxes (Stylish design and Contemporary colors) + central area chart with 10 X-axis values, 2 data series, and legend + legend key. Two text input zones and one chart data area create clear information hierarchy.
Related Products
-

Desperate Stock Price Decline Graph – The Tragedy of Market Analysis
#Market and Competitor Analysis #Graph #Competitor Analysis
-

Financial Management Analysis Detailed Graph
#Market and Competitor Analysis #Graph #Competitor Analysis
-

Broken Line Graph for Market Competitor Analysis - Insights for Competitive Advantage
#Market and Competitor Analysis #Graph #Competitor Analysis
-

Third Party Comparison Analysis Line Graph – Highlighting Market Competitiveness
#Market and Competitor Analysis #Graph #Competitor Analysis
