Closed Diagram for Science Experiments
RJ0400009_32
- Last Update 05/19/2025
- File Size 0.3MB
- # of Slides 2
- File Format PPTX
- Slide Ratio 16:9
- Color
Keywords
- #Content-Based Slides
- #Design-Based Slides
- #Product/Service Introduction
- #Diagram
- #Differentiation Strategy for Products/Services
- #Cluster
- #Closed Cluster Diagram
- #Chain Diagram
- #16:9
- #closed diagram PowerPoint
- #4-node connection diagram
- #science experiment PowerPoint slide
- #cluster diagram template
- #process flow PPT slide
About the Product
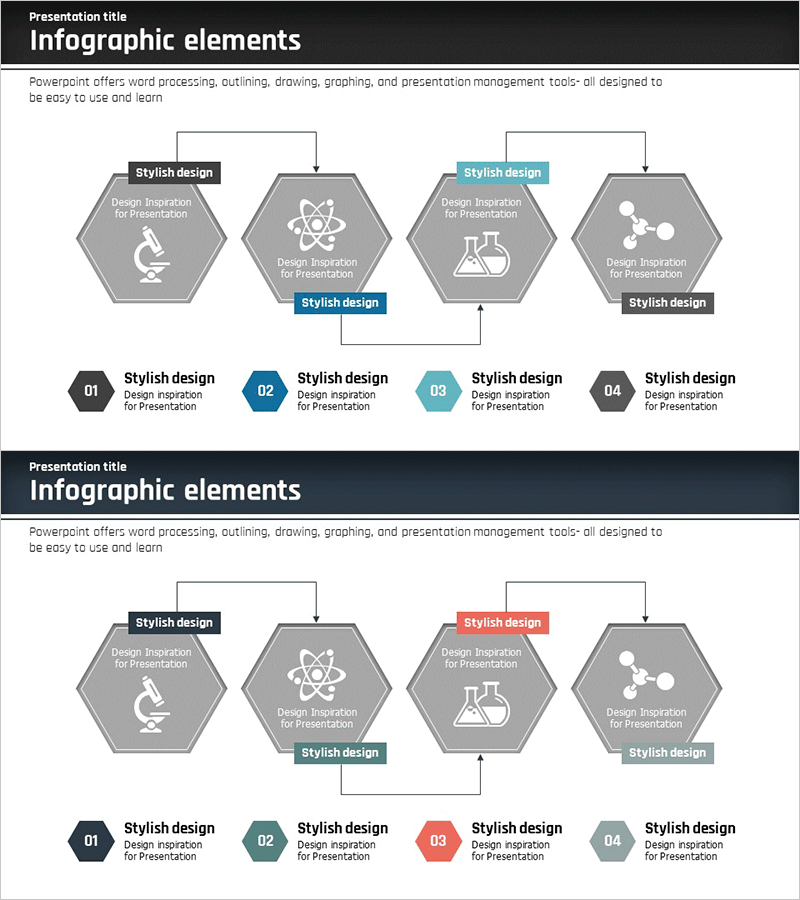
A 4-node closed diagram PowerPoint slide optimized for science experiment and product introduction presentations. Hexagonal nodes connected by directional arrows clearly express experimental stages, processes, and interdependencies. The design features a stable gray background with black, navy, and cyan accent badges distinguishing each stage, visualizing a central node connected to four surrounding nodes in all directions. The 2-slide set supports flexible data input and is fully editable in PPTX format.
Usage Points
-
Main Usage
Visualizes sequential stages of scientific experiments, product development cycles, and relationships between interconnected elements. The structure centers on a core concept with four surrounding elements connected via arrows, effectively expressing cause-effect relationships, feedback loops, and system interactions.
-
How to Use
Enter experiment stage names, product characteristics, or process elements into each hexagonal node. Adjust arrow directions to represent unidirectional, bidirectional, or circular flows. Modify badge colors (black, navy, cyan) to distinguish categories, priorities, or phases, and customize background color and text size to match your brand identity.
-
Recommended For
Science and medical professionals, product development teams, research institution report writers, IT specialists explaining system architecture, and business process improvement managers will find this template highly applicable.
-
Slide Structure
2-slide set. Each slide features one central hexagonal node surrounded by four peripheral nodes in a closed connection structure. Directional arrows between nodes express sequential flow and interdependencies, with numbered badges (01–04) indicating order. Optimized for 16:9 widescreen display.
Related Products
-

The Strength of the Media – Diagram Template for Presentation
#Product/Service Introduction #Diagram #Differentiation Strategy for Products/Services
-

Visualizing Efficient Execution Strategy – Differentiated Approach
#Product/Service Introduction #Business Vision and Strategy #Diagram
-

Medical Service Differentiation Strategy Diagram
#Company Introduction #Product/Service Introduction #Diagram
-

Blue Green Plus Diagram – Product/Service Differentiation Strategy
#Product/Service Introduction #Business Introduction #Diagram
