Business Area Linkage Overlay Diagram
RJ0400009_21
- Last Update 05/19/2025
- File Size 0.3MB
- # of Slides 2
- File Format PPTX
- Slide Ratio 16:9
- Color
Keywords
- #Content-Based Slides
- #Design-Based Slides
- #Company Introduction
- #Business Vision and Strategy
- #Diagram
- #Business Areas
- #Business Goals
- #Cluster
- #Chain Diagram
- #16:9
- #overlay diagram PowerPoint
- #business area linkage slide
- #cluster diagram template
- #business relationship chart PPT
- #interconnection diagram presentation
- #how to create cluster diagram in PowerPoint
About the Product
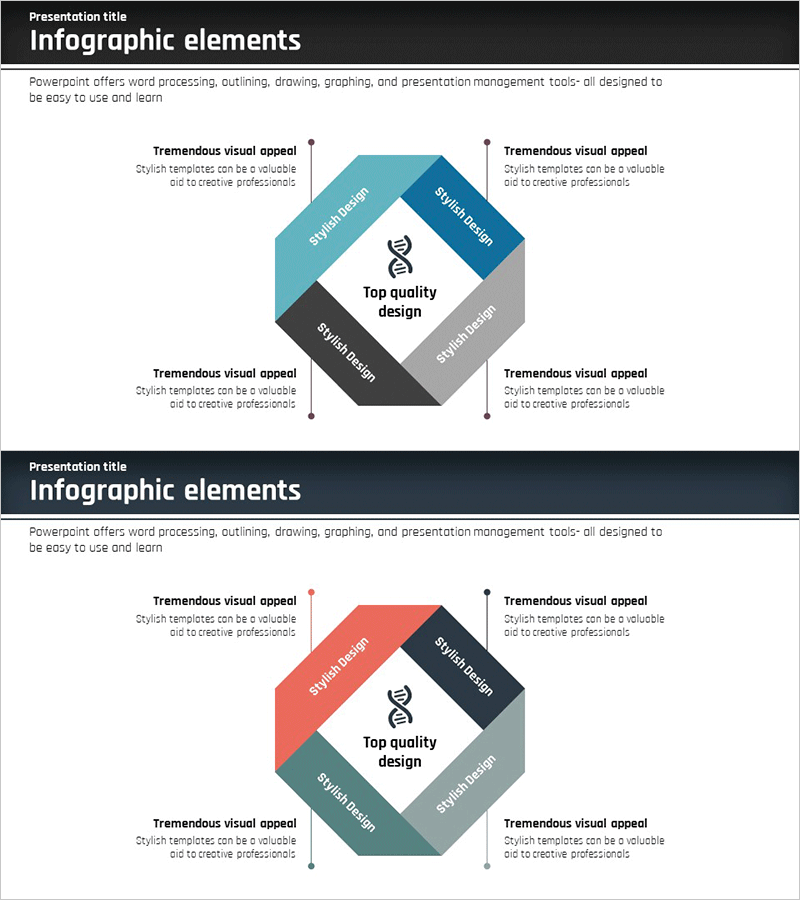
A nested cluster diagram PowerPoint slide that visualizes interconnections between business areas and organizational units. Four rectangular zones overlap around a central concept, intuitively expressing cross-functional relationships and integrated strategy. The multi-color palette of teal, navy, charcoal, and gray clearly distinguishes each zone, while arrows and text labels emphasize relational dynamics. The 2-slide set offers varied color combinations optimized for 16:9 widescreen format. This presentation template is ready to use for business strategy, organizational structure, and process integration presentations.
Usage Points
-
Main Usage
Designed to clearly illustrate mutual interactions, integration, and collaboration between multiple business areas or organizational units. The overlapping structure centered on a core concept simultaneously expresses both independence and connectivity of each zone, making complex business structures transparent and comprehensible.
-
How to Use
Apply to executive briefings, business strategy presentations, organizational restructuring explanations, and new business initiative planning to demonstrate inter-departmental collaboration or business portfolio composition. Edit zone labels to reflect actual business names, department titles, or process names, and customize colors to match organizational branding.
-
Recommended For
Executive management, strategic planning teams, business development professionals, organizational restructuring leads, C-suite executives, consulting firms, investment relations specialists, and corporate strategists presenting business portfolios, organizational hierarchies, and strategic partnerships.
-
Slide Structure
2-slide set featuring identical structural layouts with varied color schemes. Each slide displays four rectangular zones overlapping around a central focal point in an overlay configuration, with text labels and directional arrows positioned within each zone. Optimized for 16:9 widescreen format to suit contemporary presentation environments.
Related Products
-

Collaborative Business Diagram – Business Strategy and Goals
#Company Introduction #Business Vision and Strategy #Diagram
-

AI Service Main Business Areas – Vision of Innovation and Growth
#Company Introduction #Business Vision and Strategy #Diagram
-

Business Strategy Presentation Using Triangle Diagram
#Company Introduction #Business Vision and Strategy #Diagram
-

Stable Business Goal Connection Diagram
#Company Introduction #Business Vision and Strategy #Diagram
