Energy Presentation Wide – Modern and Dynamic Design
J0300079
- Last Update 08/31/2025
- File Size 8.3MB
- # of Slides 31
- File Format PPTX
- Slide Ratio 16:9
- Color
Slide Preview


Keywords
About the Product
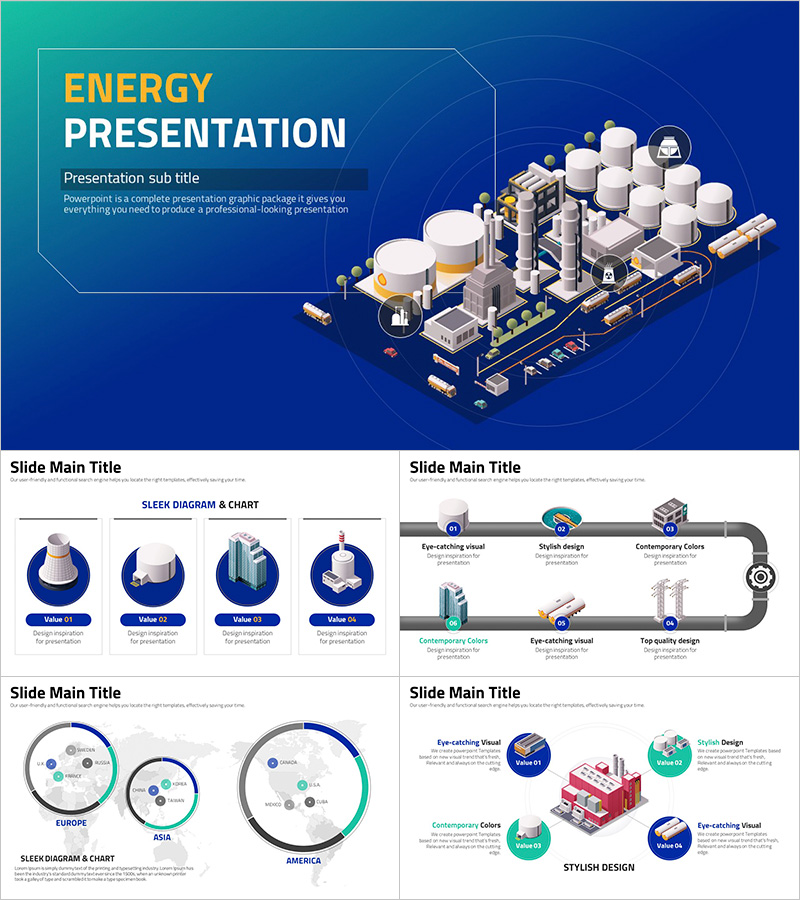
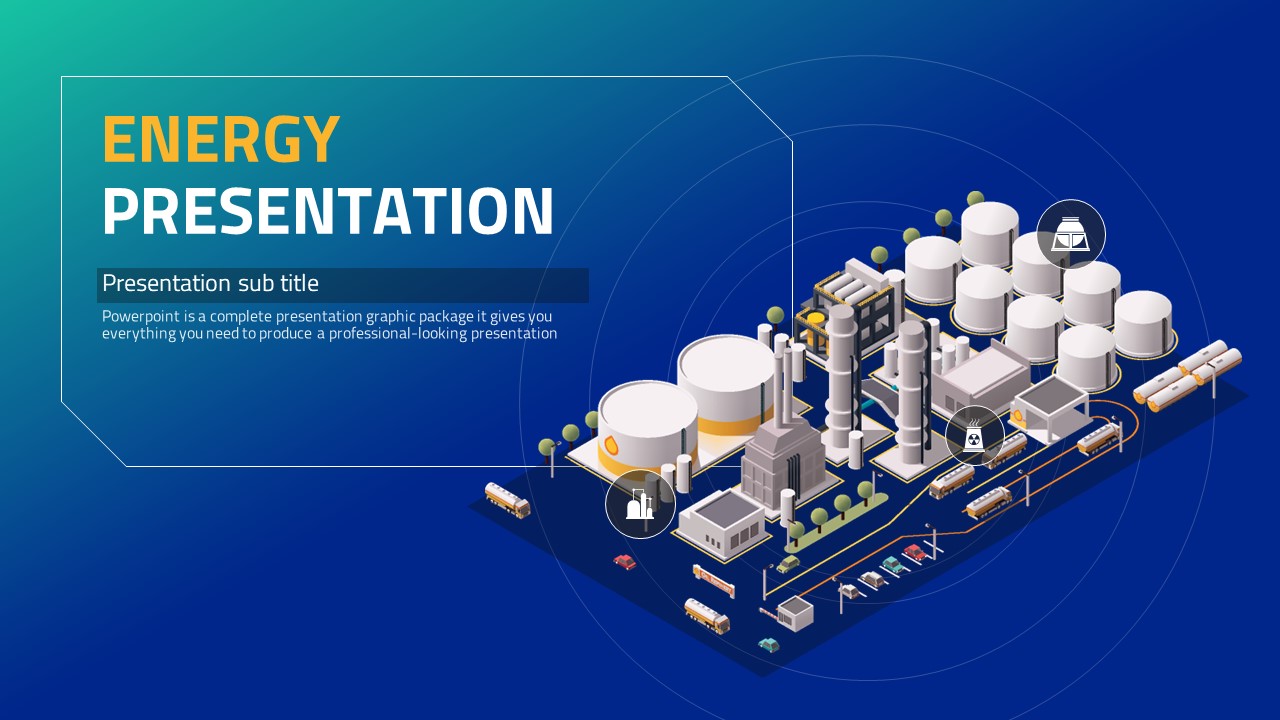
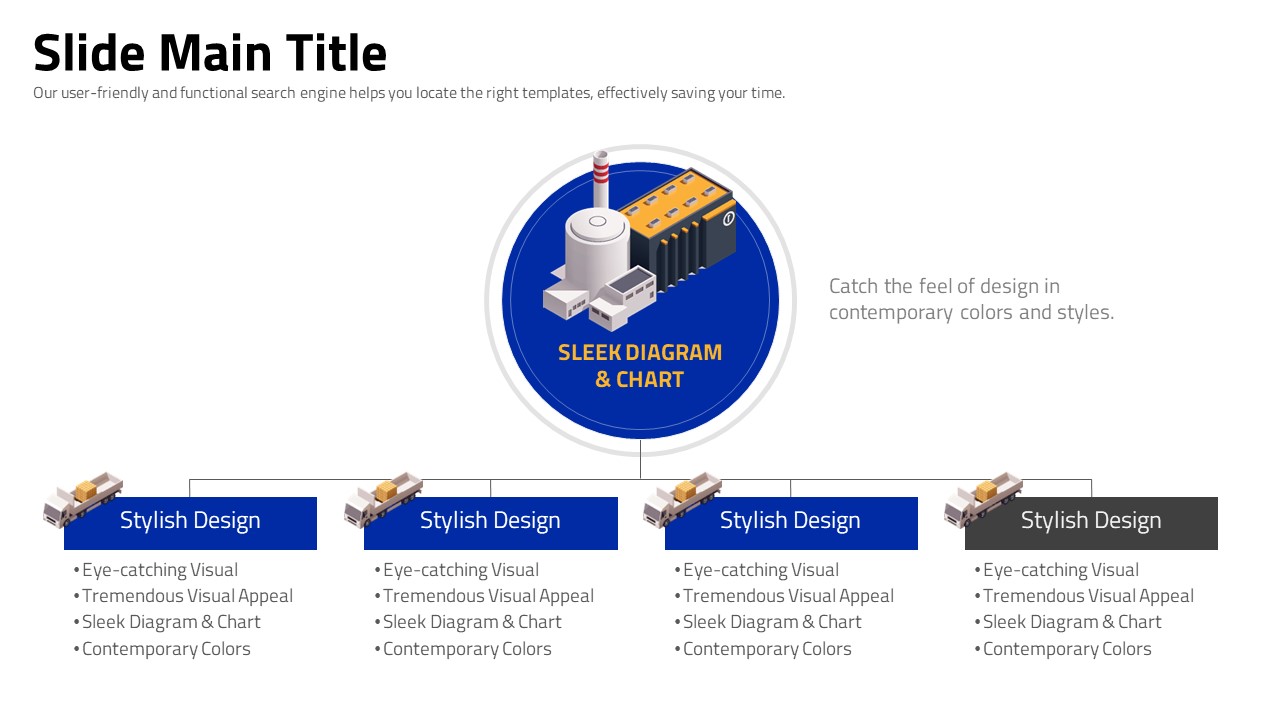
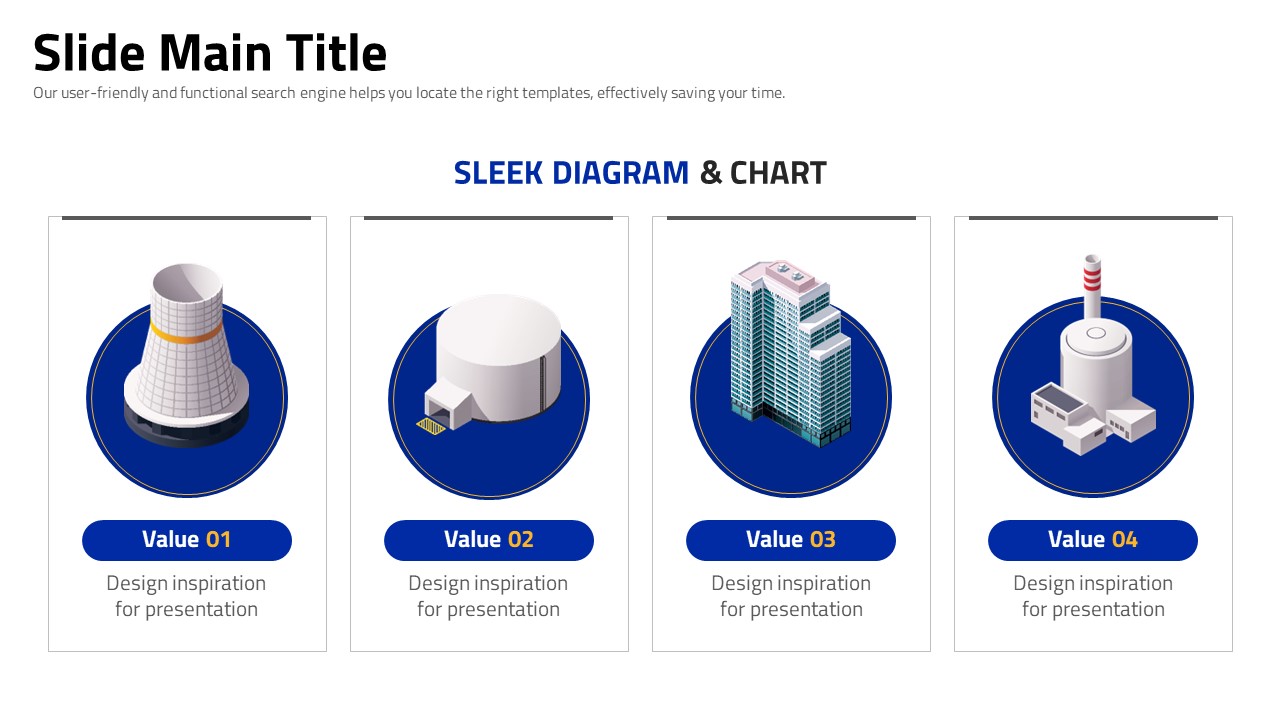
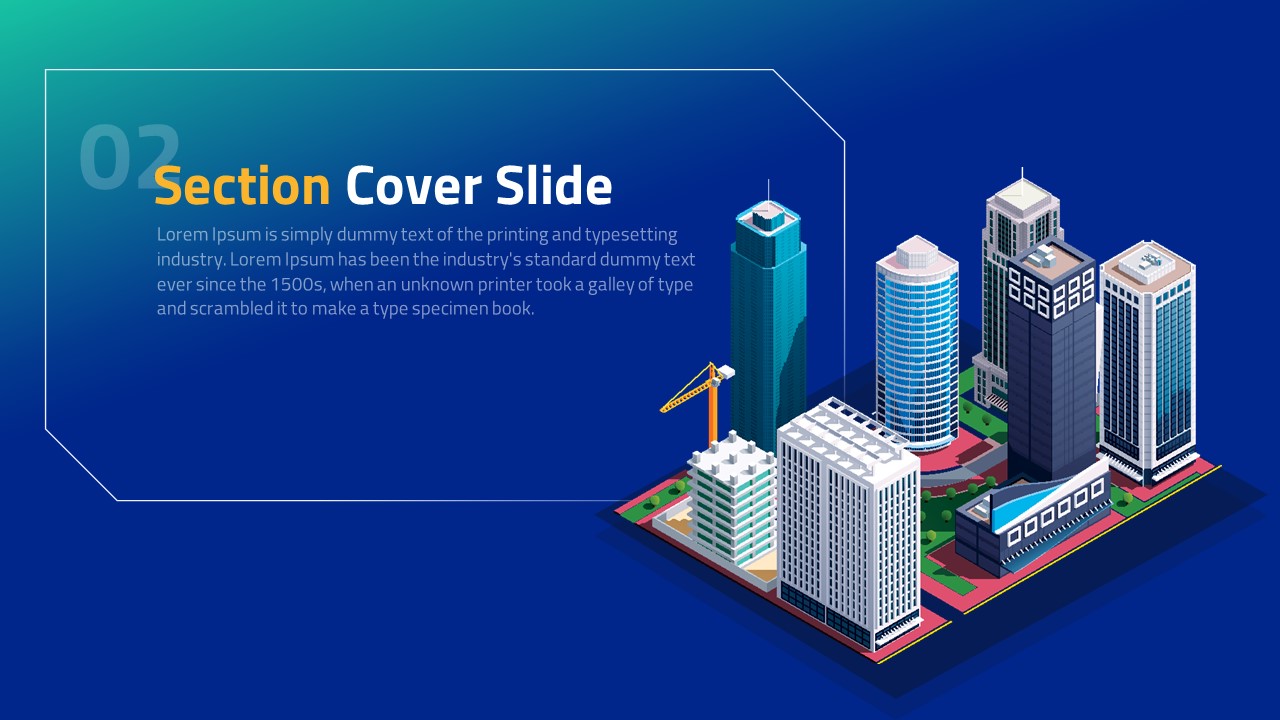
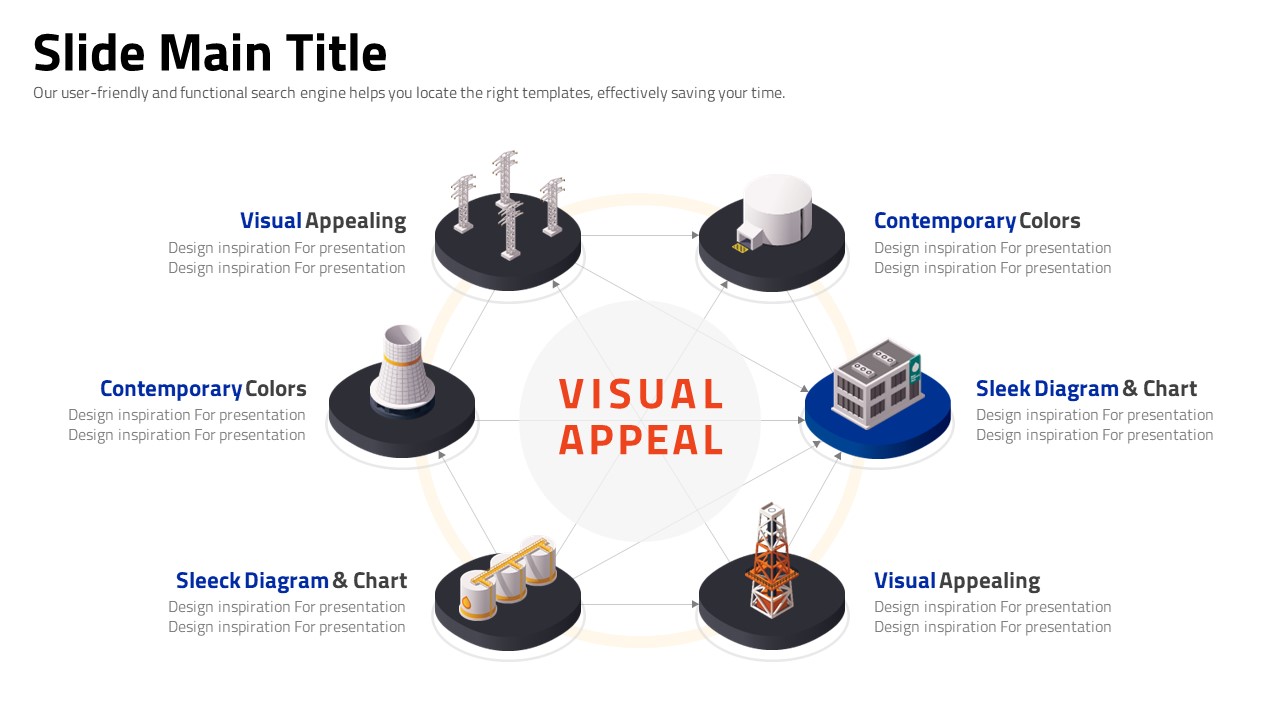
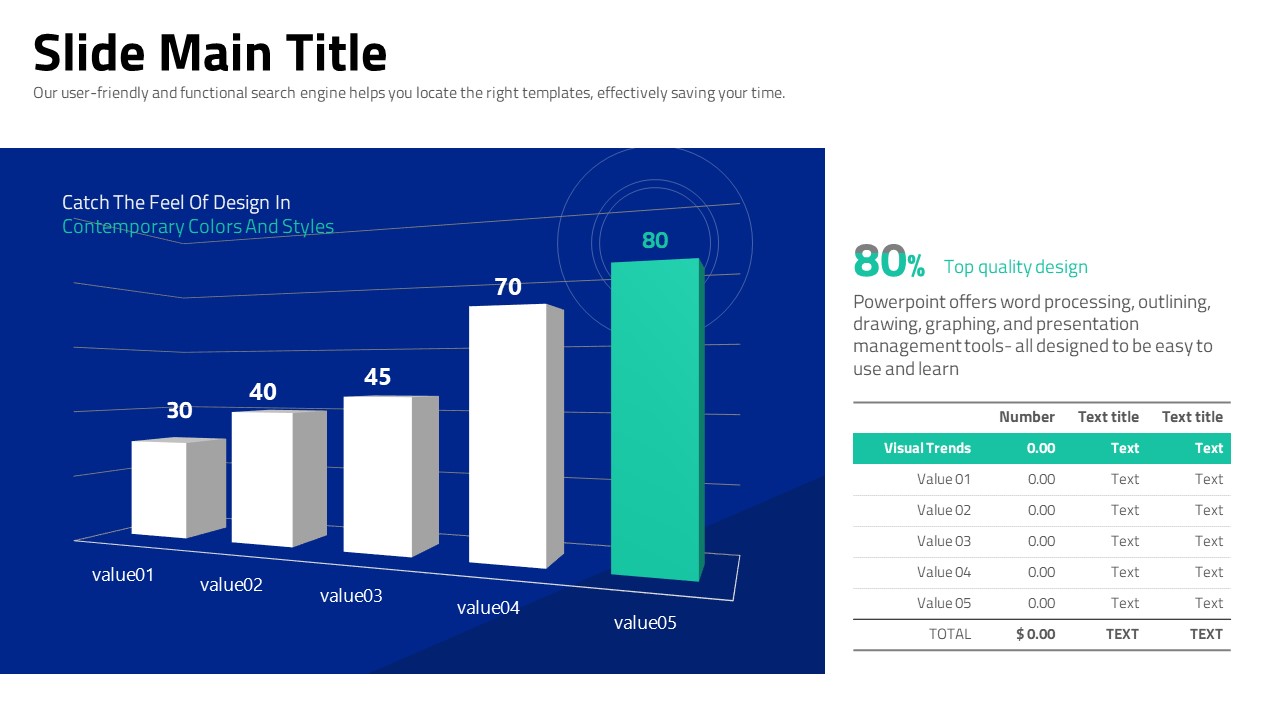
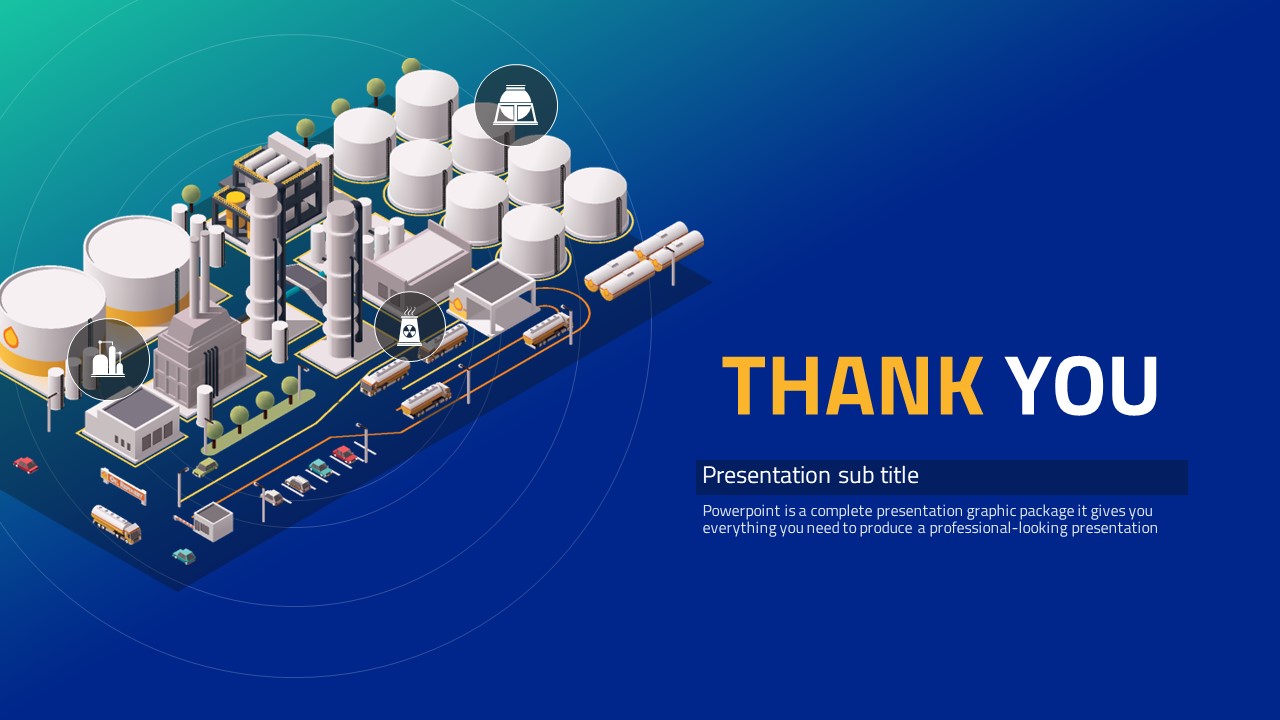
A professional PowerPoint template designed for energy, plant, and manufacturing industry presentations. Built on a deep royal-blue background with yellow and orange accent colors, this template conveys the dynamism and authority of the industrial sector. Isometric 3D illustrations of energy plants, factories, and pipelines are integrated throughout the slides, making it easy to visualize complex industrial structures at a glance. The 31-slide deck covers a wide range of layouts: title slide, 5-section table of contents, four-panel circular icon diagrams, world map data slides segmented by Europe, Asia, and the Americas, radial relationship diagrams, and hierarchical tree charts. Delivered in 16:9 widescreen PPTX format, every element—text, colors, and images—is fully editable. Use it for investor relations presentations, business performance reports, global market analysis decks, or corporate strategy briefings. Simply replace the placeholder content with your own data and brand colors to produce a polished, industry-ready presentation in minutes.
Usage Points
-
Main Usage
Designed for energy, petrochemical, plant, and manufacturing companies to deliver IR pitches, business performance reports, and global market analysis presentations with a professional, industry-specific visual identity.
-
How to Use
Download the PPTX file and open it in PowerPoint or a compatible application. Replace the placeholder text, data, and colors with your own content. The isometric illustrations and diagram layouts remain intact, so you can produce a polished presentation quickly without redesigning from scratch.
-
Recommended For
Ideal for planning, marketing, and IR professionals at energy and manufacturing firms, industrial consultants, and business executives who need to present global market data or operational overviews to investors and stakeholders.
-
Slide Structure
Includes 31 slides: a deep-blue isometric plant title slide, a 5-section table of contents, four-panel circular icon diagrams, Europe/Asia/Americas world map data slides, a radial relationship diagram, and a hierarchical tree chart for structured data presentation.
Related Products
-

Multitasking Presentation Template – Optimized Design for Business
#Business
-

Fountain Pen Theme Presentation – Elegant Business Slide Design
#Business
-

Container PPT Wide Template – Efficient Business Presentation Design
#Business
-

Business Work Item Presentation Template – Professional Design
#Business
