Sleek Infographic Diagram for Value Presentation – Visually Appealing Slide
RJ0300079_28
- Last Update 11/06/2025
- File Size 0.2MB
- # of Slides 2
- File Format PPTX
- Slide Ratio 16:9
- Color
Keywords
- #Content-Based Slides
- #Design-Based Slides
- #Product/Service Introduction
- #Marketing Plan and Strategy
- #Diagram
- #Differentiation Strategy for Products/Services
- #Marketing Strategy
- #Flow
- #Circular Flow
- #16:9
- #circular diagram PowerPoint
- #2-stage cycle diagram slide
- #value proposition diagram template
- #business process PowerPoint slide
- #data visualization presentation template
About the Product
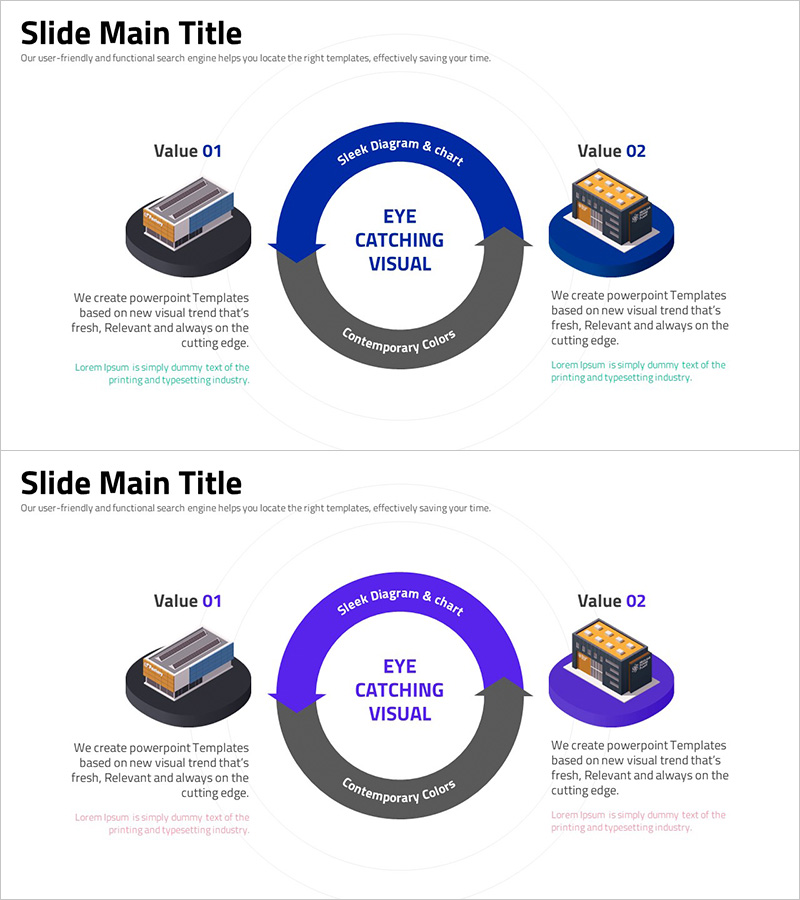
A PowerPoint slide featuring a two-stage circular diagram with a central core message flanked by left and right value elements. The design uses dark blue and gray arrow rings flowing clockwise, with icons and text areas positioned at each stage to clearly express information flow. Ideal for business proposals, product introductions, and value proposition sections in presentations. The template includes 2 slides with color variations (blue and purple) in 16:9 widescreen format, ready for immediate editing and customization.
Usage Points
-
Main Usage
Visualizes the relationship or cyclical process between a central concept and two flanking value elements. Effectively communicates product core value, business model cycles, bidirectional customer journeys, and interconnected strategic components.
-
How to Use
Replace the central 'EYE CATCHING VISUAL' text with your core message. Update 'Value 01' and 'Value 02' sections with corresponding benefits, features, or process stages. Modify the arc text labels ('Sleek Diagram & chart', 'Contemporary Colors') to match your presentation context, and swap icons to align with your topic.
-
Recommended For
Recommended for value proposition sections in business proposals, feature comparison in product introduction decks, customer journey mapping in marketing plans, business model explanation in business plans, and cyclical structure illustration in investment pitch decks.
-
Slide Structure
2-slide set with dual color variations (blue and purple). Each slide features a central circular arrow ring with symmetric left-right layout. Includes 2 arc-shaped text areas (top and bottom), 2 icon zones (left and right), and 2 text box areas (left and right) for a total of 6 editable input regions.
Related Products
-

Gradient Color Cycle Diagram – Product and Service Strategy
#Product/Service Introduction #Marketing Plan and Strategy #Diagram
-

Service Differentiation Strategy Circular Diagram
#Product/Service Introduction #Marketing Plan and Strategy #Diagram
-

Visualizing Marketing Strategy with Circular Diagram – Effective Product Presentation
#Product/Service Introduction #Marketing Plan and Strategy #Diagram
-

Visualizing Marketing Strategies with Circular Arrow Diagram
#Product/Service Introduction #Marketing Plan and Strategy #Diagram
