More Choices in Visual Trends for Effective Presentation Design
RJ0300079_25
- Last Update 11/06/2025
- File Size 0.4MB
- # of Slides 2
- File Format PPTX
- Slide Ratio 16:9
- Color
Keywords
- #Content-Based Slides
- #Design-Based Slides
- #Product/Service Introduction
- #Business Introduction
- #Graph
- #Composition
- #Technological Status
- #Other
- #Radar Chart Spider Chart
- #16:9
- #radial diagram PowerPoint
- #central expansion slide template
- #8-node diagram
- #presentation diagram slide
- #how to create radial diagram in PowerPoint
About the Product
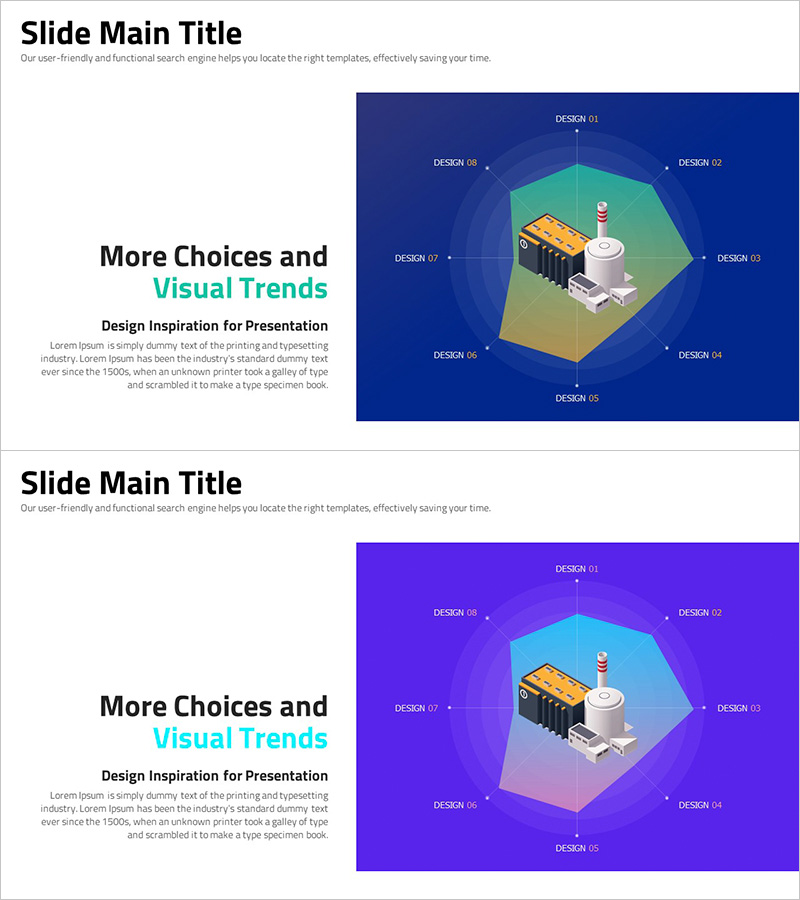
A radial diagram PowerPoint slide featuring eight nodes expanding outward from a central concept in all directions. The design uses a dark blue background with turquoise green accent hexagonal nodes and connecting lines that clearly express visual hierarchy. Each node includes label text placement, and a 3D isometric illustration element is positioned at the center to enhance visual interest in your presentation. The 2-slide set offers multiple color combinations (dark blue and purple backgrounds) and is optimized for 16:9 widescreen format. Provided in fully editable PPTX format, allowing you to freely modify text and colors to match your presentation topic.
Usage Points
-
Main Usage
Optimized for visually expressing relationships between a core concept and related elements. Ideal for strategy development, organizational structure, process flow, marketing channels, business models, and other topics requiring clear center-to-periphery relationship communication.
-
How to Use
Enter your central concept in the middle node, then place related items in the eight surrounding nodes. Edit node text and colors to customize for your presentation topic. Utilize both dark blue and purple color versions to apply different backgrounds for different sections.
-
Recommended For
Executive reports, strategic planning presentations, marketing strategy development, organizational restructuring explanations, new business introductions, product ecosystem descriptions, customer journey mapping, team role assignments, and all presentation scenarios requiring emphasis on relationships between central and peripheral elements.
-
Slide Structure
2-slide set with each slide featuring one central hexagonal node and eight radial surrounding nodes. Connection lines between nodes are clearly displayed, with a 3D isometric illustration positioned at the center as a visual focal point. Layout is optimized for 16:9 widescreen format.
Related Products
-

Data Analysis Radial Graph for Performance Visualization – Trust and Professionalism
#Product/Service Introduction #Business Introduction #Diagram
-

Diagram Introducing Effective Farming Methods
#Product/Service Introduction #Business Introduction #Composition
-

Composition Content Bar Graph – Information Delivery and Analysis
#Product/Service Introduction #Business Introduction #Graph
-

Radar Chart for Supplements Presentation
#Product/Service Introduction #Graph #Features
