Efficient Presentation Through Data Visualization – Modern Square Slide Design
RJ0300079_5
- Last Update 09/11/2025
- File Size 3.3MB
- # of Slides 2
- File Format PPTX
- Slide Ratio 16:9
- Color
Keywords
- #Content-Based Slides
- #Design-Based Slides
- #Company Introduction
- #Market and Competitor Analysis
- #Graph
- #Text Box
- #Company Overview
- #Competitive Advantage
- #Circles
- #Doughnut Chart
- #Rounded Rectangle Text Box
- #16:9
- #rounded square text box PowerPoint
- #data visualization slide template
- #4-item comparison diagram
- #business report PPT
- #concentric circle chart slide
About the Product
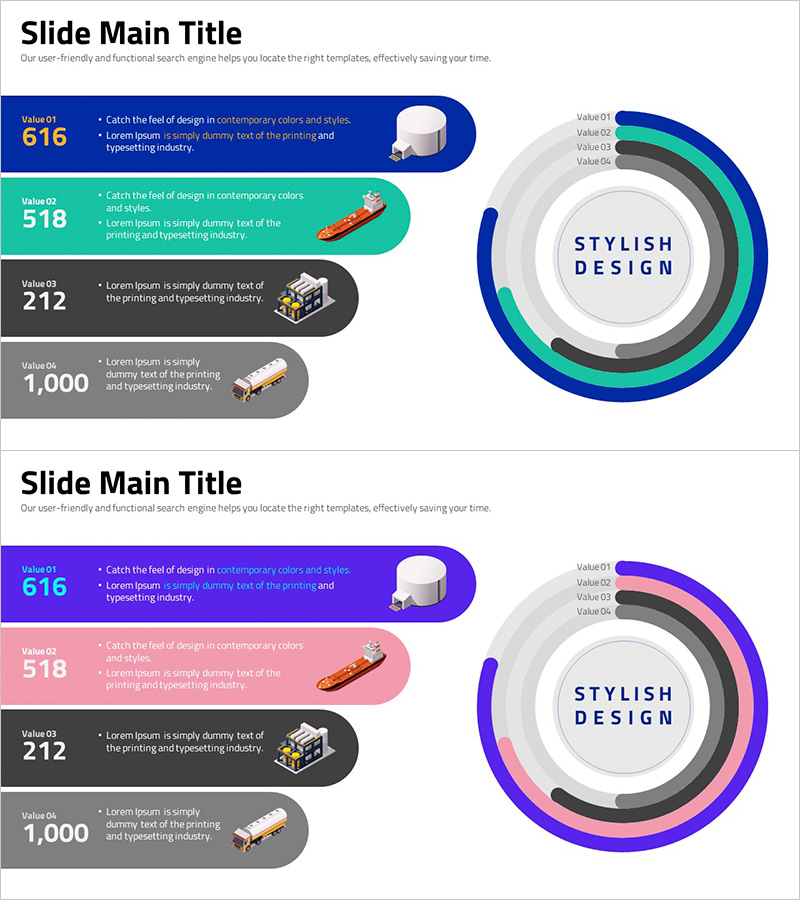
A professional PowerPoint slide featuring rounded square text boxes paired with a concentric circle diagram for intuitive business data presentation. The left side displays four rounded-corner boxes with numerical values and descriptions, while the right side uses a layered circular diagram to represent hierarchical relationships. Color-coded elements in blue, teal, pink, and gray distinguish each data point, with 3D icons reinforcing information credibility. This 2-slide deck in 16:9 widescreen format is ready for immediate use in reports, presentations, and strategic pitches.
Usage Points
-
Main Usage
Designed to compare four key metrics, performance indicators, or value propositions simultaneously while expressing hierarchical relationships. The left-side text boxes accommodate numerical data, titles, and descriptions, while the right-side concentric circles visualize each item's position within the overall structure. Maximizes information clarity in report summaries, strategic plans, and analytical presentations.
-
How to Use
Input numerical values (616, 518, 212, 1,000) and descriptive text into each of the four rounded boxes on the left. Customize the concentric circle colors on the right to match your data series, and replace the 3D icons with images representing each category's characteristics. Adjust background colors and fonts to align with your corporate branding guidelines.
-
Recommended For
Ideal for executives, analysts, and marketing professionals presenting quarterly performance, budget allocation, customer segments, or product categories. Effectively structures complex data in financial reports, business plans, marketing strategy presentations, and investor pitch decks.
-
Slide Structure
Slide 1: Title area + four rounded square boxes on left (each containing numerical value, title, and descriptive text) + concentric circle diagram on right (blue, teal, pink, gray rings) + four 3D icons. Slide 2: Identical layout with purple and pink color variation. 16:9 aspect ratio, PPTX format.
Related Products
-

Status of Transportation Service Analysis – Comprehensive Market Insights
#Company Introduction #Market and Competitor Analysis #Diagram
-

Farm Donut Chart Blue Green – Market Competitive Analysis
#Market and Competitor Analysis #Graph #Competitor Analysis
-

Pizza and Competition Graph – Market Analysis Essential
#Market and Competitor Analysis #Graph #Competitive Advantage
-

Graph of Environmental Pollution – Market Share Analysis
#Market and Competitor Analysis #Graph #Market Share
