Infographic Slide Highlighting Oil Rig Platform
RJ0300079_20
- Last Update 09/11/2025
- File Size 0.3MB
- # of Slides 2
- File Format PPTX
- Slide Ratio 16:9
- Color
Keywords
About the Product
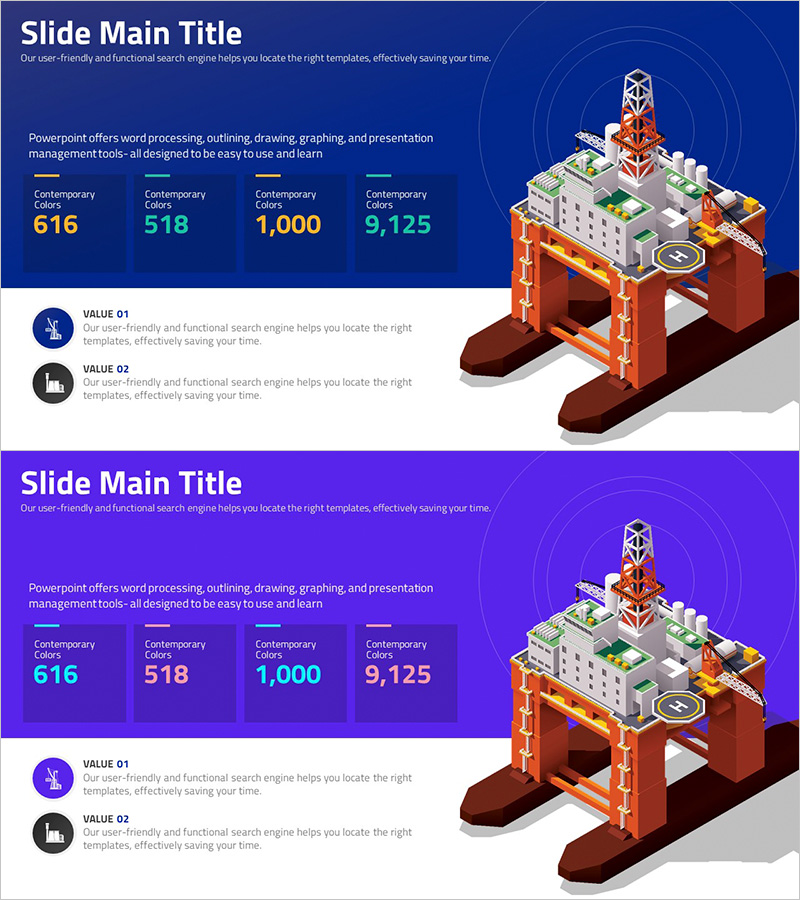
A business overview infographic PowerPoint slide featuring a 3D isometric oil drilling platform. This presentation slide uses a dark blue background with orange-toned structural elements and key metrics (616, 518, 1,000, 9,125) to visually communicate your company's core indicators and value propositions. The 2-slide deck in 16:9 widescreen PPTX format is fully editable and ready to customize. Perfect for energy, construction, and infrastructure industry presentations where you need to highlight business scope and operational scale.
Usage Points
-
Main Usage
Communicate your company's business scope and key performance indicators through a single, visually compelling infographic slide. The 3D isometric platform representation makes industry characteristics (energy, construction, infrastructure) immediately recognizable, while numeric data and value statements reinforce your business positioning for investors, partners, and stakeholders.
-
How to Use
Insert this slide into the business overview section of company profiles, business plans, or investor pitch decks. Customize the dark blue background and orange accent colors to match your corporate brand guidelines, then replace the sample metrics with your actual business data. The clear separation between text and image areas makes editing straightforward and non-destructive.
-
Recommended For
Ideal for energy, oil & gas, construction, infrastructure, and manufacturing companies presenting business overviews. Particularly effective for investor presentations, partner meetings, and employee onboarding materials where visual impact and industry relevance are critical. Transforms complex business structures into clear, memorable visuals.
-
Slide Structure
Two-slide deck with consistent layout: left side contains title and descriptive text, right side features the 3D isometric platform image with four metric data boxes. Information hierarchy flows from top (main title) through middle (description) to bottom (VALUE 01 and VALUE 02 icon-text sections), creating clear visual organization and easy readability.
Related Products
-

Timepiece Theme Company Overview - Business Insights and Presentation
#Company Introduction #Business Introduction #Diagram
-

Nature Theme Business Introduction Slide – Cluster Diagram Utilization
#Company Introduction #Business Introduction #Diagram
-

Stock Business Overview Slide – Visualizing Stock Market Data
#Company Introduction #Business Introduction #Company Overview
-

Square Diagram for Effective Company Presentation – Cluster Format
#Company Introduction #Business Introduction #Diagram
