Vertical Area Chart for Data Analysis Visualization – Contemporary Colors and Attractive Design
RJ0300079_27
- Last Update 11/06/2025
- File Size 0.9MB
- # of Slides 2
- File Format PPTX
- Slide Ratio 16:9
- Color
Keywords
- #Content-Based Slides
- #Design-Based Slides
- #Business Vision and Strategy
- #Marketing Plan and Strategy
- #Graph
- #Business Goals
- #Marketing Objectives
- #Other
- #Area Chart
- #16:9
- #area chart PowerPoint
- #vertical area graph template
- #multi-series data visualization slide
- #trend analysis presentation
- #how to create area chart in PowerPoint
About the Product
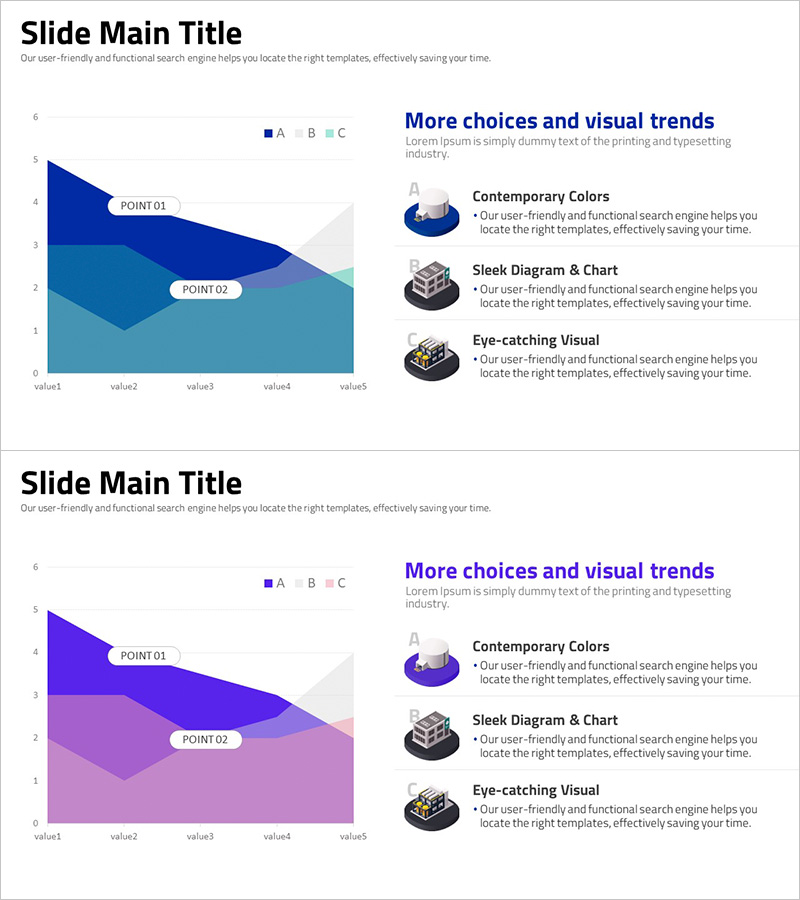
A vertical area chart PowerPoint slide that visualizes time-series and multi-series data with intuitive clarity. The design features a gradient background in blue, teal, and lavender tones with white point labels highlighting data transitions. The 2-slide set includes a cumulative area chart with 5 data points on the first slide, and a second layout combining the chart with 3 descriptive text blocks and icons on the right. Available in 16:9 widescreen PPTX format for immediate editing. Ideal for business analytics presentations including revenue trends, cost breakdowns, customer satisfaction metrics, and market performance analysis.
Usage Points
-
Main Usage
Displays cumulative changes and multi-series comparisons across time periods in a single visual. Effectively represents revenue progression, cost composition, market share evolution, and customer segment trends for comprehensive data storytelling.
-
How to Use
Input actual data into the area chart on the first slide and customize the descriptive text and icons on the second slide to match your presentation context. Use PowerPoint's chart editing tools to adjust series count, colors, and legend. Background gradients and point labels are fully customizable.
-
Recommended For
Financial analysis, marketing reports, business performance reviews, and strategic planning presentations. Recommended for CFOs, marketing managers, executives, consultants, and data analysts presenting quarterly or annual performance analysis and forecasts.
-
Slide Structure
2-slide set. Slide 1: Vertical area chart with 5 data points and legend (A, B, C). Slide 2: Area chart on left + 3 icon-text blocks on right (Contemporary Colors, Sleek Diagram & Chart, Eye-catching Visual). 16:9 aspect ratio, PPTX format.
Related Products
-

Diet Pyramid Strategy Presentation Slide
#Business Vision and Strategy #Marketing Plan and Strategy #Diagram
-

Surgical Drape Theme Goal Diagram – Business Vision and Strategy
#Business Vision and Strategy #Marketing Plan and Strategy #Diagram
-

Ultimate Business Goals Diagram
#Business Vision and Strategy #Marketing Plan and Strategy #Diagram
-

Three-dimensional Pyramid Box for Goal Setting Presentation
#Business Vision and Strategy #Marketing Plan and Strategy #Diagram
