Sleek Infographic: Modern Colors and Chart Slide Design
RJ0300079_19
- Last Update 11/06/2025
- File Size 0.2MB
- # of Slides 2
- File Format PPTX
- Slide Ratio 16:9
Keywords
About the Product
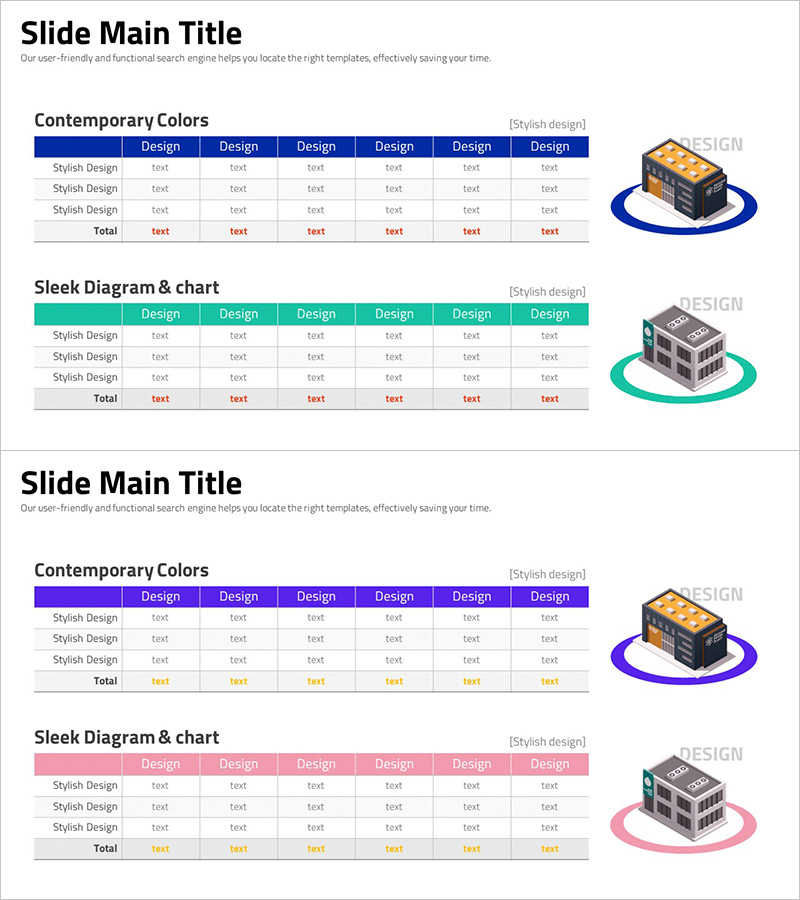
A two-slide PowerPoint set featuring modern horizontal data comparison tables with dark blue and turquoise headers. Each slide presents a structured six-column layout for organizing and comparing quantitative information across multiple categories. The design includes clear row separations, color-coded headers, and designated summary rows for totals or key metrics. Ideal for business presentations, market analysis reports, product comparisons, and performance dashboards. Fully editable in all PowerPoint versions, 16:9 widescreen format, PPTX file type.
Usage Points
-
Main Usage
Designed to present structured quantitative data across multiple dimensions in a clear, scannable format. Perfect for product specification comparisons, market research findings, departmental performance metrics, competitive benchmarking, and financial summaries. The color-coded headers and row divisions guide audience attention and improve information retention.
-
How to Use
Simply click into any table cell and type your data, or copy-paste existing information from spreadsheets. The header row is pre-formatted for category labels, and the bottom row is designated for totals or summary metrics. Easily add or remove rows and columns, adjust colors, or modify fonts to match your brand guidelines.
-
Recommended For
Finance, marketing, and sales teams presenting quarterly reports; product management teams conducting competitive analysis; executive-level performance reviews; client proposals requiring data-driven comparisons. Suitable for any business context where structured numerical comparison enhances decision-making.
-
Slide Structure
Slide 1: Dark blue header (6 columns) + 3 data rows + red-highlighted summary row. Slide 2: Turquoise header (6 columns) + 3 data rows + orange-highlighted summary row. All cells are editable, with consistent row heights and column widths ensuring professional alignment and readability.
Related Products
-

Stylish Design for Data Visualization – Business Insights
#Financial Plans and Performance #Diagram #Income Statement
-

Transportation Business Sales and Profit Table – Financial Analysis
#Financial Plans and Performance #Diagram #Income Statement
-

Business Income Statement Slide – Table for Financial Clarity
#Financial Plans and Performance #Diagram #Income Statement
-

Profit Analysis Graph – Visualizing Financial Performance
#Financial Plans and Performance #Diagram #Income Statement
