Visualizing Country Design Preferences with Rectangle Diagrams
RJ0300079_21
- Last Update 09/11/2025
- File Size 0.7MB
- # of Slides 2
- File Format PPTX
- Slide Ratio 16:9
- Color
Keywords
- #Content-Based Slides
- #Design-Based Slides
- #Market and Competitor Analysis
- #Marketing Plan and Strategy
- #Graph
- #Other
- #Target Market
- #Target Market Strategy
- #Horizontal Bar
- #Grouped Horizontal Bar
- #Map
- #16:9
- #world map PowerPoint slide
- #country data visualization
- #geographic comparison chart
- #international business presentation
- #regional analysis slide template
About the Product
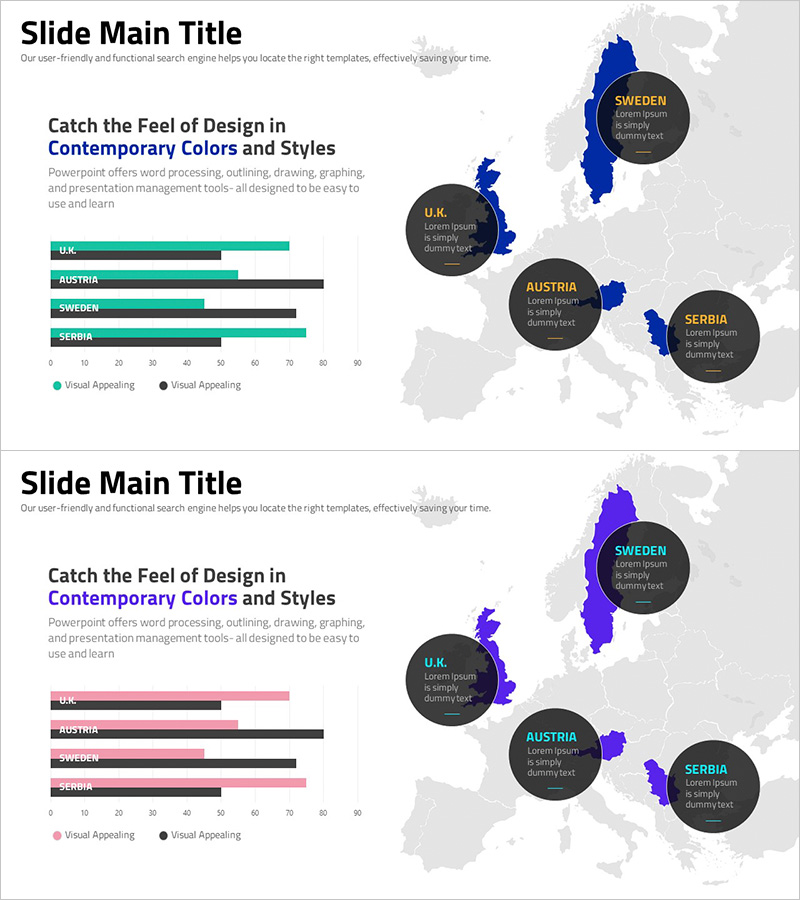
A professional PowerPoint slide that visualizes design preferences across four European countries (UK, Austria, Sweden, Serbia) using a world map combined with horizontal bar charts. Each country is highlighted on the map with circular data callouts, while the left side displays comparative bar graphs in teal and black tones. This dual-view approach enables audiences to understand both geographic distribution and quantitative differences simultaneously. The 2-slide set includes color variations (teal/pink and teal/black) suitable for international business reports, market analysis presentations, and regional performance reviews.
Usage Points
-
Main Usage
Designed for international market analysis, regional performance comparison, and global business reporting. The world map visualization combined with quantitative bar graphs helps audiences grasp geographic context while understanding numerical data, supporting data-driven decision-making across regions.
-
How to Use
Input country-specific metrics (revenue, customer satisfaction, market share, etc.) into the left-side bar chart, and the corresponding data automatically displays in the circular callouts on the map. Two color schemes (teal/pink and teal/black) are provided; select the variant matching your corporate brand guidelines.
-
Recommended For
International marketing managers, global sales teams, executive report writers, and regional performance analysts. Ideal for multinational company meetings, international conferences, investor presentations, and regional expansion strategy briefings.
-
Slide Structure
2-slide set featuring a world map (gray background) with 4 highlighted countries, circular data callouts (dark background), and a left-side horizontal bar chart (4 items, dual teal/black series). Formatted in 16:9 widescreen for modern presentation environments.
Related Products
-

US Target Market Strategy Map – Insights for Effective Marketing
#Market and Competitor Analysis #Marketing Plan and Strategy #Graph
-

Target Market Strategy for the US Region PowerPoint Slide
#Market and Competitor Analysis #Marketing Plan and Strategy #Other
-

European Target Country Analysis Graph – Strategic Market Insights
#Market and Competitor Analysis #Marketing Plan and Strategy #Graph
-

European Target Region Market Strategy – Effective Market Analysis
#Market and Competitor Analysis #Marketing Plan and Strategy #Other
