Sleek Diagrams and Charts for Effective Schedule Management
RJ0300079_29
- Last Update 11/06/2025
- File Size 0.9MB
- # of Slides 2
- File Format PPTX
- Slide Ratio 16:9
- Color
Keywords
- #Content-Based Slides
- #Design-Based Slides
- #Business Strategy
- #Operational Plan
- #Diagram
- #Roadmap
- #Project Implementation Schedule
- #Table
- #Standard Table
- #16:9
- #schedule timeline diagram PowerPoint
- #project schedule slide template
- #horizontal bar chart PPT
- #Gantt-style timeline slide
- #meeting schedule PowerPoint
- #diagram slide template download
About the Product
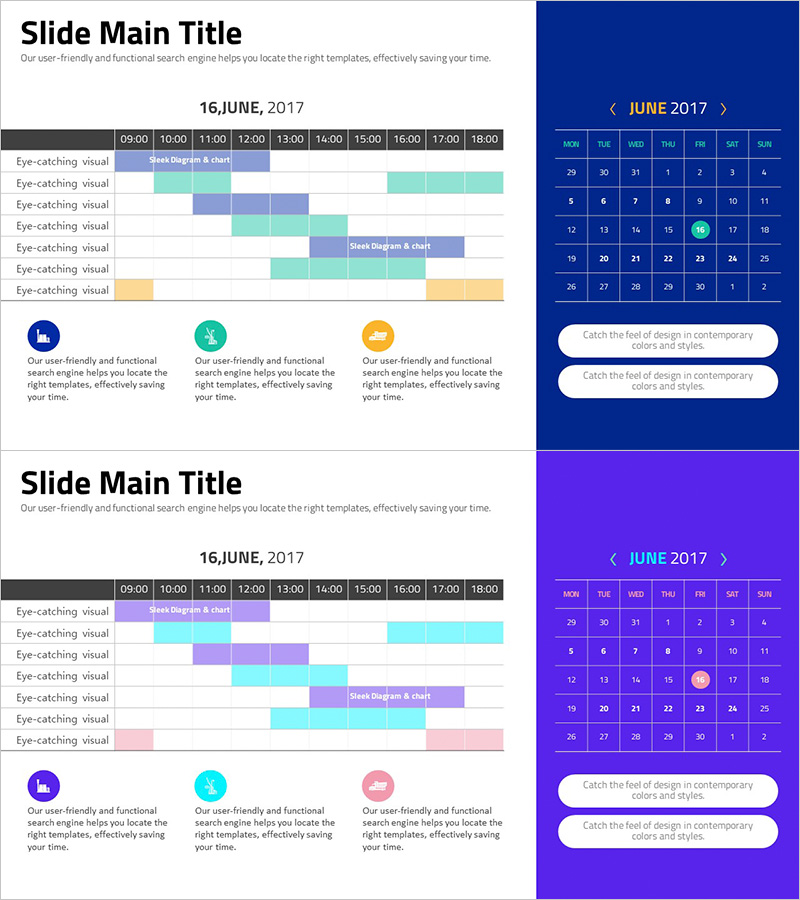
A horizontal bar timeline diagram PowerPoint slide for visualizing project schedules and meeting times across multiple tasks. Features color-coded time blocks (navy, teal, purple, orange) representing different schedule items from 09:00 to 18:00, paired with a calendar view for date reference. This 2-slide deck enables immediate use in project status reports, team scheduling meetings, and resource allocation presentations.
Usage Points
-
Main Usage
Visualize project timelines, meeting schedules, and resource allocation across time blocks so teams instantly grasp scheduling priorities. The paired calendar and timeline layout communicates both specific dates and hourly time slots simultaneously.
-
How to Use
Deploy in project kickoff meetings, weekly/monthly status reports, resource planning presentations, and team collaboration sessions. Use color blocks to represent task duration and calendar section to highlight critical dates or milestones.
-
Recommended For
Project managers, team leads, operations coordinators, and planning teams presenting schedule updates. Ideal for cross-functional organizations in construction, IT, marketing, and manufacturing where timeline alignment is essential.
-
Slide Structure
Slide 1: Seven horizontal bar items spanning 09:00–18:00 with color differentiation, labeled 'Sleek Diagram & chart'; Slide 2: June 2017 calendar grid with date highlights, three icon sections with descriptive text areas below
Related Products
-

Simple Business Roadmap – Project Schedule Visualization
#Business Strategy #Operational Plan #Diagram
-

Future Plan Roadmap Table – Business Implementation Strategy
#Business Strategy #Operational Plan #Diagram
-

Business Idea Service Roadmap – Business Strategy
#Business Strategy #Operational Plan #Diagram
-

Business Promotion Schedule Roadmap – Effective Operational Plan
#Business Strategy #Operational Plan #Diagram
