Slide Visualizing America with Contemporary Colors
RJ0300079_26
- Last Update 05/11/2025
- File Size 4.1MB
- # of Slides 2
- File Format PPTX
- Slide Ratio 16:9
- Color
Keywords
- #Content-Based Slides
- #Design-Based Slides
- #Market and Competitor Analysis
- #Marketing Plan and Strategy
- #Graph
- #Other
- #Target Market
- #Target Market Strategy
- #Circles
- #Doughnut Chart
- #Map
- #16:9
- #USA map PowerPoint slide
- #geographic data visualization
- #bubble map presentation
- #regional distribution chart
- #world map slide template
About the Product
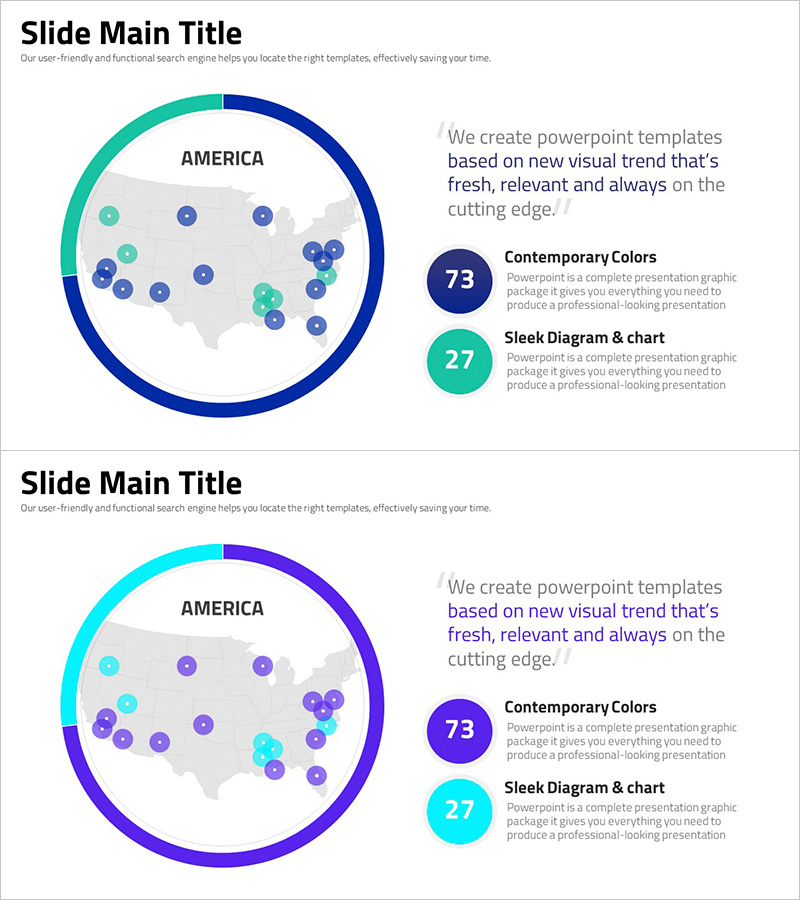
A geography-focused PowerPoint slide visualizing the United States with a circular frame design in teal and navy tones. The map features distributed bubble nodes of varying sizes across different regions, enabling clear representation of location-based data, branch distribution, and regional metrics. The 2-slide set includes two color variations (teal-navy and cyan-purple) for flexible presentation themes. Delivered in 16:9 widescreen PPTX format, fully editable for immediate use in business presentations and reports.
Usage Points
-
Main Usage
Visualizes geographic location-based data, branch networks, and regional distribution across the United States. Ideal for presenting market expansion strategies, global business presence, regional performance metrics, and location-specific insights in corporate presentations and investor pitches.
-
How to Use
Edit the bubble node sizes, colors, and positions to reflect actual regional data. Add numbers, labels, or text to each node representing sales figures, branch counts, customer distribution, or market share by region. Select the color variation that best matches your presentation theme and customize the legend area with relevant metrics.
-
Recommended For
Global corporations presenting regional business performance, marketing teams showcasing market entry strategies, investor relations presentations on geographic expansion, consulting firms analyzing regional markets, educational institutions highlighting international networks, and sales teams demonstrating territory coverage.
-
Slide Structure
2-slide set with identical layouts in different color schemes. Each slide features a centered USA map enclosed by a circular frame in teal-navy or cyan-purple tones. Approximately 20-25 bubble nodes of varying sizes are distributed across the map regions. A legend area on the right side accommodates custom text, numbers, and data labels for regional metrics.
Related Products
-

Area Graph for Competitor Analysis
#Market and Competitor Analysis #Marketing Plan and Strategy #Graph
-

Infographic Slide for Regional Data Visualization
#Market and Competitor Analysis #Marketing Plan and Strategy #Graph
-

Analysis of European Target Regions – Insights for Marketing Strategy Development
#Market and Competitor Analysis #Marketing Plan and Strategy #Graph
-

Graph of the Status of European Target Region Analysis – Market Trends Visualization
#Market and Competitor Analysis #Marketing Plan and Strategy #Graph
