Stylish Design Visual – Effective Presentation Material
RJ0300079_9
- Last Update 05/11/2025
- File Size 0.3MB
- # of Slides 2
- File Format PPTX
- Slide Ratio 16:9
- Color
Keywords
About the Product
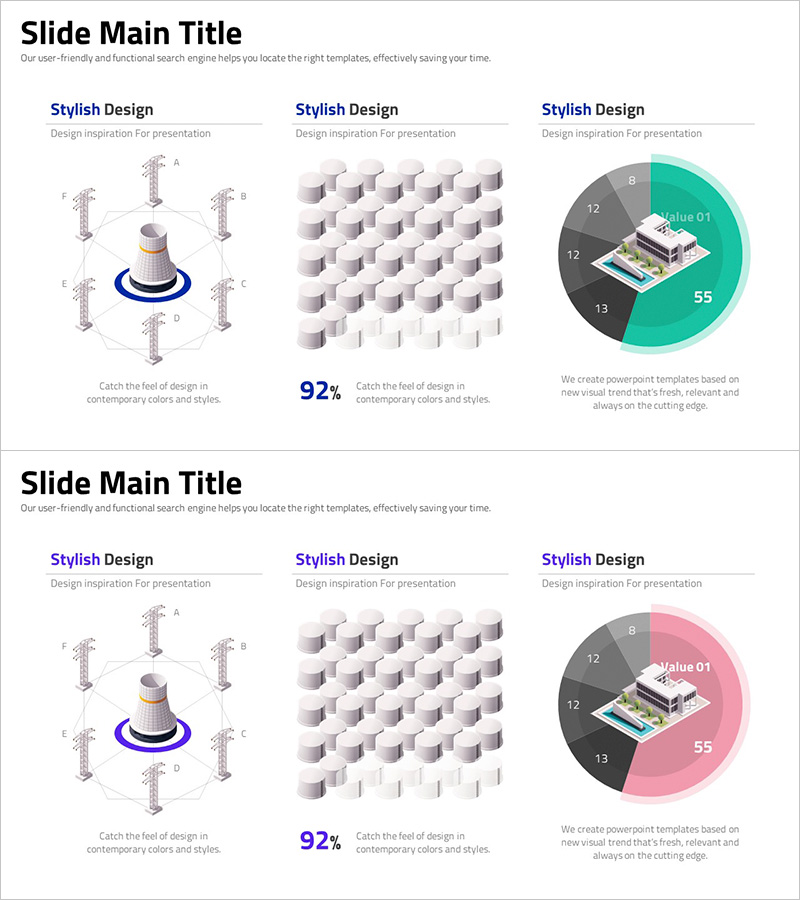
A professional pie chart PowerPoint slide designed to visualize data proportions with clarity and impact. The template features a 4-segment circular chart in turquoise and gray tones, with clearly labeled sections and numerical values for each segment. Ideal for presentations requiring market share analysis, budget allocation, composition breakdown, or comparative ratio visualization. The 2-slide layout in 16:9 widescreen format enables flexible data representation across multiple scenarios while maintaining visual consistency and modern presentation standards.
Usage Points
-
Main Usage
Enables clear visualization of how individual components contribute to a whole, making complex proportion data immediately understandable to audiences. Perfect for presenting market share, budget distribution, customer demographics, revenue breakdown, and other part-to-whole relationships in business contexts.
-
How to Use
Simply edit the numerical values and labels in each segment to input your actual data. The turquoise accent color naturally draws attention to key segments, while the gray background provides visual balance. Use both slides to compare data across different time periods or scenarios.
-
Recommended For
Executive reports, business performance presentations, marketing analytics, financial summaries, customer segmentation analysis, and strategic planning sessions. Particularly valuable for consultants, data analysts, business planners, finance professionals, and project managers presenting quantitative insights.
-
Slide Structure
4-segment pie chart with editable numerical values and labels positioned around the circle. Central space accommodates icons or images for additional context. Descriptive text area below the chart for explanations or source citations. Two identical slide layouts enable consistent multi-scenario data presentation.
Related Products
-

Current Status of Energy Business Development – Pie Chart for Business Intro
#Product/Service Introduction #Business Introduction #Graph
-

Navy Yellow Pie Charts and Analysis - Effective Data Visualization
#Company Introduction #Business Introduction #Graph
-

Business 3D Pie Chart – Optimized for Market and Competitor Analysis
#Product/Service Introduction #Market and Competitor Analysis #Graph
-

Business Analysis Pie Chart
#Product/Service Introduction #Market and Competitor Analysis #Graph
