Manufacturing Production PPT - Visual Communication for Business Presentations
J0300069
- Last Update 01/07/2025
- File Size 5.6MB
- # of Slides 32
- File Format PPTX
- Slide Ratio 16:9
- Color
Slide Preview


Keywords
About the Product
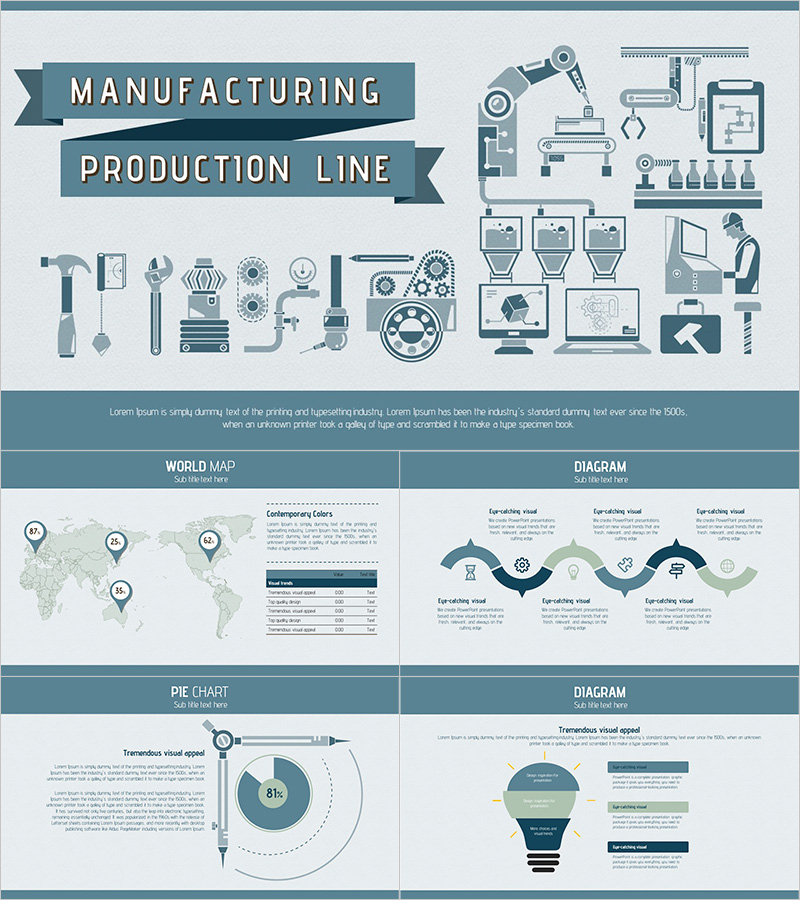
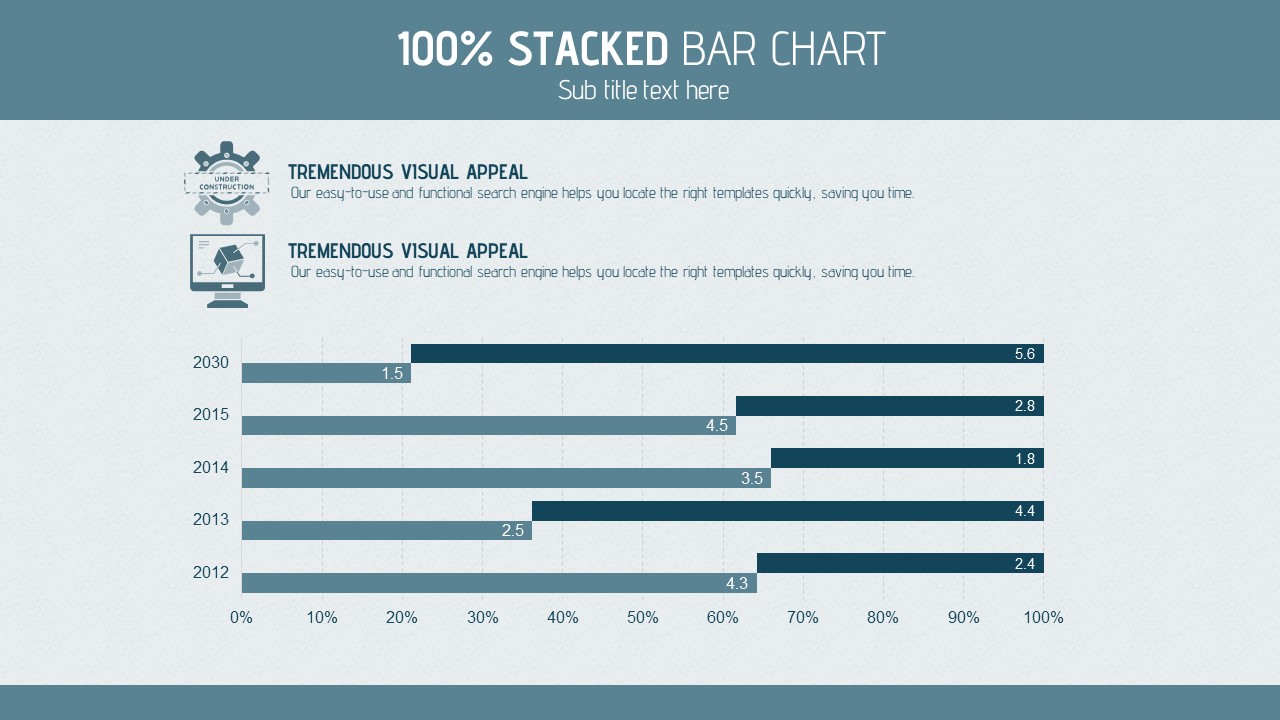
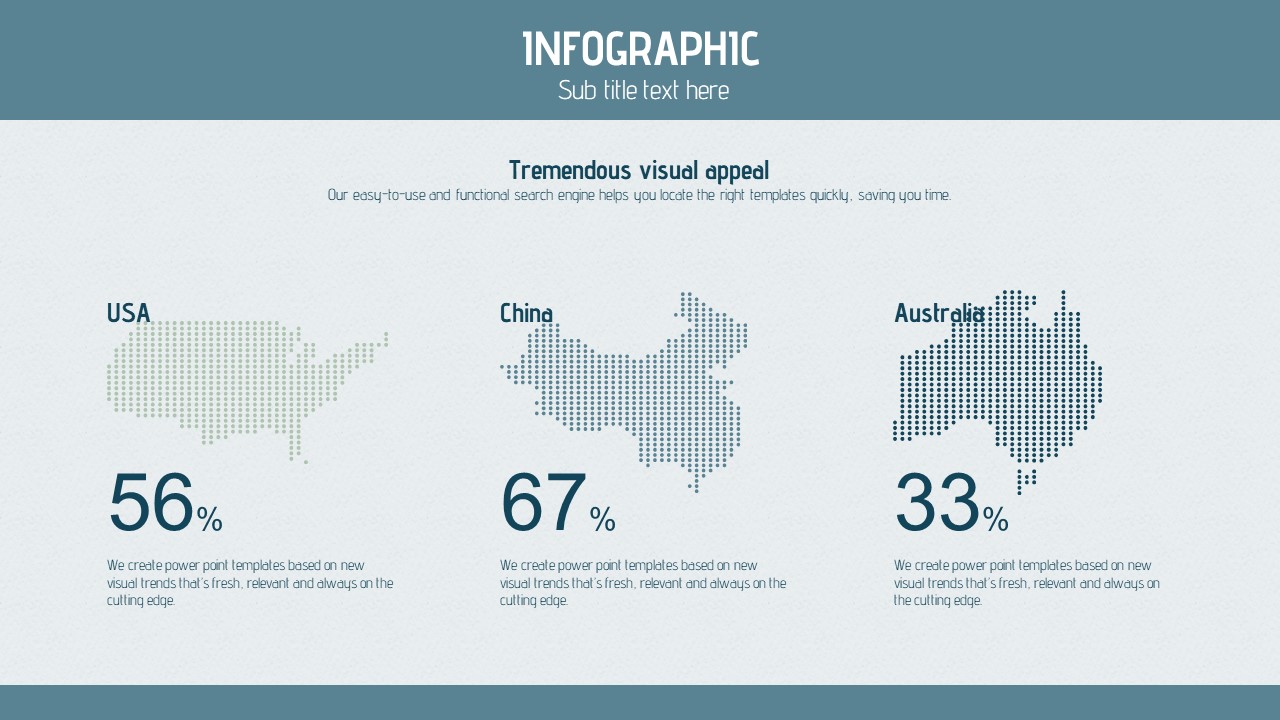
A 32-slide PowerPoint template set purpose-built for manufacturing and production management presentations. The design uses a restrained two-color palette of teal and slate gray, conveying industrial professionalism and reliability without visual clutter. Flat-icon infographics depicting robotic arms, conveyor belts, tools, and factory workers are woven throughout the slides, making complex production processes immediately understandable at a glance. The deck includes a variety of data visualization slides — bar charts, pie charts, a world map layout, and multi-step diagrams — so you can present production performance, global supply chains, team structures, and operational workflows in a single cohesive presentation. All slides are delivered in fully editable PPTX format, allowing you to swap text, figures, colors, and icons to match your company's branding. Whether you're preparing a quarterly factory report, a supplier pitch, or an internal operations review, this presentation template gives your slides a consistent, industry-appropriate look.
Usage Points
-
Main Usage
Ideal for presenting production line overviews, factory performance reports, global supply chain analyses, and team introductions in manufacturing, logistics, and industrial operations contexts.
-
How to Use
Download the PPTX file and open it directly in PowerPoint. Replace placeholder text and figures with your own data, update bar and pie charts via linked Excel data, and swap icons or colors to align with your corporate brand guidelines.
-
Recommended For
Manufacturing managers, production planners, supply chain and logistics teams, industrial consultants, and sales professionals who need to present factory operations or production data to internal stakeholders or external clients.
-
Slide Structure
Includes a title slide with production-line infographic, world map + diagram composite slide, 6-step circular process diagram, year-over-year bar chart, team member introduction slide, pie chart with idea diagram, and additional supporting slides — 32 slides total.
Related Products
-

Business Partnership PowerPoint Template – Build Trust with Elegant Design
#Business
-

Partnership PowerPoint Template – Ideal for Business Presentations
#Business
-

Opinion PPT Wide – Stylish Design for Effective Presentations
#Business
-

Business Work Item Presentation Template – Professional Design
#Business
