Country-specific Dot Map Graph – Visual Tool for Market Analysis
RJ0300069_23
- Last Update 05/07/2025
- File Size 0.9MB
- # of Slides 2
- File Format PPTX
- Slide Ratio 16:9
- Color
Keywords
- #Content-Based Slides
- #Design-Based Slides
- #Market and Competitor Analysis
- #Marketing Plan and Strategy
- #Graph
- #Other
- #Target Market
- #Target Market Strategy
- #16:9
- #country dot map PowerPoint slide
- #market analysis presentation template
- #regional market comparison graph
- #marketing strategy PPT
- #competitive analysis slide
About the Product
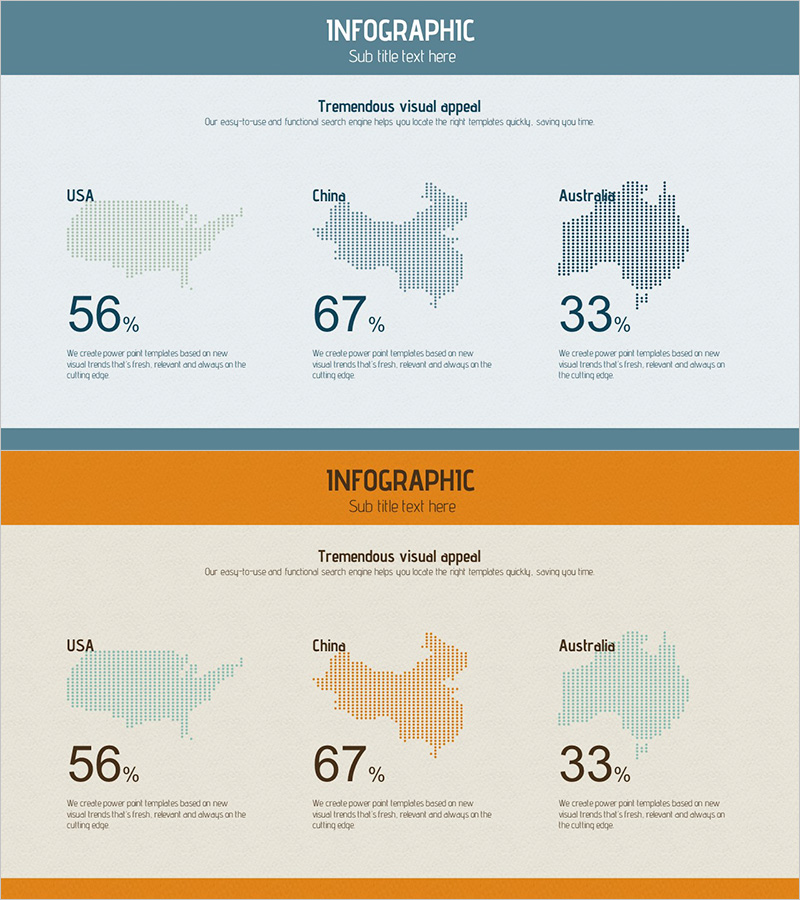
A PowerPoint slide visualizing market conditions across three countries (USA, China, Australia) using dot map representation. Market share percentages (56%, 67%, 33%) are expressed through dot density on geographic maps, enabling intuitive regional market size comparison. Available in two color versions—slate blue and orange—with dedicated header and description text areas for customization. The slide structure accommodates title and analytical insights aligned with your presentation context. Immediately applicable for marketing strategy, competitive analysis, and market entry planning presentations.
Usage Points
-
Main Usage
When developing global market expansion strategies, this slide enables side-by-side comparison of key market sizes (USA, China, Australia) at a glance. Dot density intuitively conveys relative market share magnitudes, supporting decision-making for investors, executives, and marketing teams.
-
How to Use
Enter a title such as 'Global Market Overview' or 'Target Market Analysis' in the header area, then add market share interpretation and strategic insights in the text fields below each map. Select the color version matching your corporate brand guidelines and insert into your presentation deck.
-
Recommended For
Marketing and strategy team market analysis presentations, executive reports on global market conditions, investment pitch decks highlighting market opportunities, new business expansion planning presentations, and competitive landscape assessments.
-
Slide Structure
Two-slide layout with header area (title input field) + three country dot maps (USA, China, Australia) positioned centrally + numerical data and description text zones beneath each map. Optimized for 16:9 widescreen format with two color theme options: slate blue and orange.
Related Products
-

US Target Market Map for Marketing Analysis
#Market and Competitor Analysis #Marketing Plan and Strategy #Graph
-

European Market Share Analysis Graph
#Market and Competitor Analysis #Marketing Plan and Strategy #Graph
-

European Target Region Strategy and Analysis
#Market and Competitor Analysis #Marketing Plan and Strategy #Graph
-

Visualizing Country Design Preferences with Rectangle Diagrams
#Market and Competitor Analysis #Marketing Plan and Strategy #Graph
