Manufacturing Analysis Graph – Market and Competitive Analysis
RJ0300069_14
- Last Update 05/07/2025
- File Size 0.7MB
- # of Slides 2
- File Format PPTX
- Slide Ratio 16:9
- Color
Keywords
- #Content-Based Slides
- #Design-Based Slides
- #Product/Service Introduction
- #Market and Competitor Analysis
- #Graph
- #Development Status
- #Market Analysis
- #Horizontal Bar
- #Circles
- #Segmented Horizontal Bar
- #Pie Chart
- #16:9
- #pie chart PowerPoint slide
- #horizontal bar graph template
- #manufacturing analysis chart
- #market analysis slide
- #competitive comparison graph
- #data visualization PowerPoint
About the Product
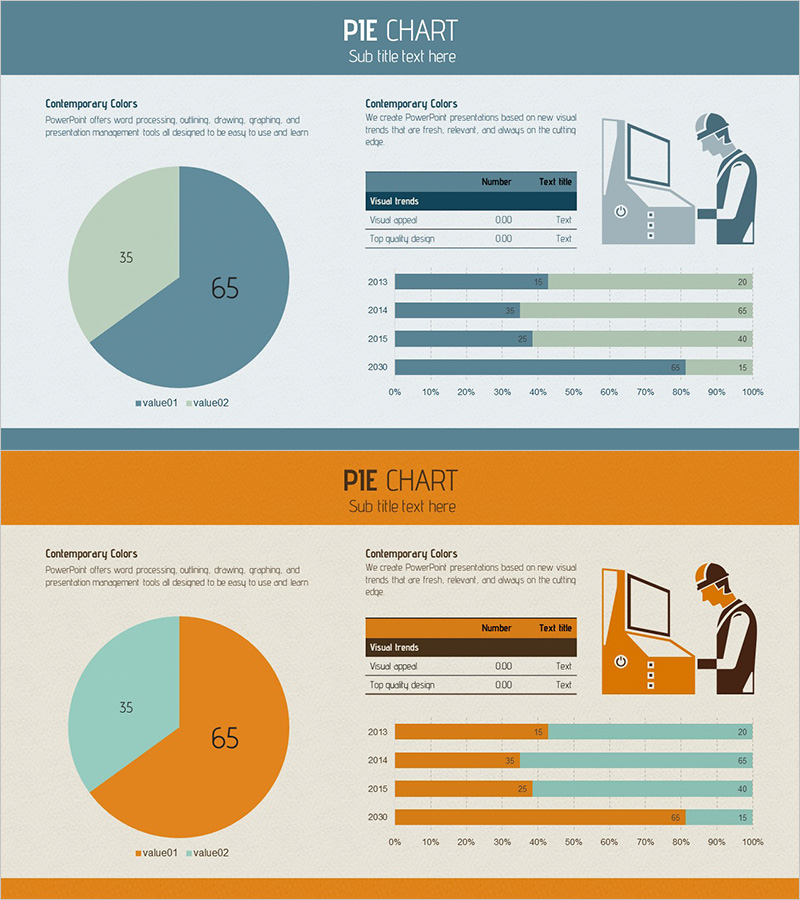
A professional PowerPoint slide set optimized for manufacturing market analysis and competitive benchmarking. This 2-slide deck combines pie charts to display proportional composition with horizontal bar graphs to visualize year-over-year trends from 2013 to 2030. The teal and mint green dual-tone background with white typography, data tables, and worker illustrations creates a polished presentation. Available in 16:9 aspect ratio and PPTX format for immediate editing. Perfect for conveying market positioning and competitive landscape in manufacturing and industrial presentations.
Usage Points
-
Main Usage
Visualize manufacturing market analysis and competitive positioning data with precision. The pie chart clearly displays market share or product composition in two segments, while the horizontal bar graph compares multi-year trends across 2013–2030 with dual data series. Quantitative insights are presented intuitively to strengthen decision-making narratives.
-
How to Use
Integrate into business plans, investment pitch decks, and market analysis reports within the market overview and competitive analysis sections. Replace pie chart values and legend with your data, update bar graph years and series values, and populate the data table with key metrics. Fully editable in PowerPoint for seamless customization.
-
Recommended For
Ideal for manufacturing and industrial sector planners, marketing professionals, and executives preparing analytical reports. Suited for market sizing estimates, competitive positioning analysis, and product portfolio reviews requiring quantitative comparison. Commonly used by consulting firms, industry analysis teams, and new business development departments.
-
Slide Structure
Slide 1: Teal header + left-aligned pie chart (2 segments: 65% and 35%) + right-aligned data table (Visual trends, Visual appeal, Top quality design) + worker illustration. Slide 2: matching header + pie chart + horizontal bar graph (2013–2030 timeline, 2 data series, 0–100% scale) + data table. 16:9 aspect ratio, 2-slide PPTX format.
Related Products
-

Pie Chart & Bar Graph for Market Analysis – Visualizing Data
#Market and Competitor Analysis #Graph #Market Status
-

Comparative Analysis Graph – Optimal Tool for Market and Competitor Analysis
#Market and Competitor Analysis #Graph #Competitor Analysis
-

Market Analysis Pie Chart – Vibrant Visualization in Contemporary Colors
#Product/Service Introduction #Market and Competitor Analysis #Diagram
-

Graph Charts for Systematic Market Analysis – Bar and Pie Charts
#Technical Approach #Market and Competitor Analysis #Diagram
