Business Sales and Profit Statement Slide – Realizing Financial Plans
RJ0300069_24
- Last Update 05/07/2025
- File Size 0.7MB
- # of Slides 2
- File Format PPTX
- Slide Ratio 16:9
- Color
Keywords
- #Content-Based Slides
- #Design-Based Slides
- #Financial Plans and Performance
- #Diagram
- #Income Statement
- #Sales and Revenue
- #Table
- #16:9
- #sales profit statement PowerPoint slide
- #financial data presentation template
- #income statement table slide
- #financial comparison analysis PPT
- #business performance report
About the Product
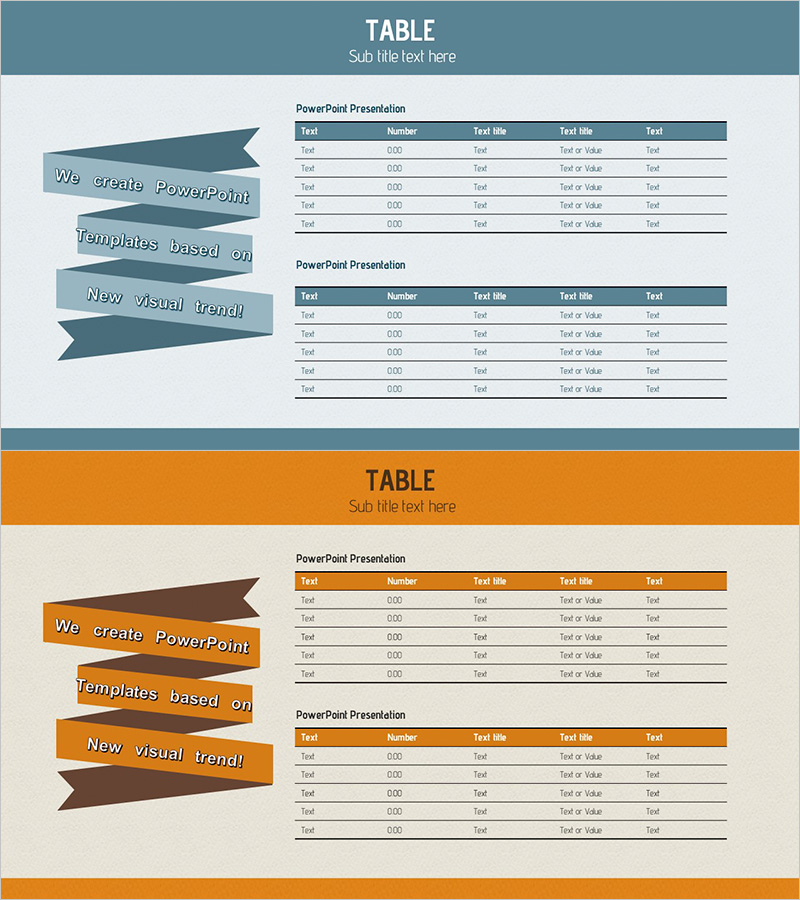
A financial data PowerPoint slide designed to compare sales and profit figures side by side. The slate-blue header and white background create strong contrast for optimal data readability, with clearly defined input areas for text, numbers, and column titles. The 2-slide set allows you to replicate the same table layout across multiple departments or reporting periods, making it ideal for visualizing financial performance over time. The left-side ribbon banner reinforces presentation professionalism, and the PPTX format enables immediate editing and customization for your specific financial metrics.
Usage Points
-
Main Usage
Optimized for presenting financial performance and business results to investors, shareholders, and executives. The table format clearly organizes key financial metrics such as revenue, profit margin, and expenses, supporting data-driven decision-making and enabling period-to-period or department-to-department comparative analysis.
-
How to Use
Enter your actual financial data—revenue figures, profit rates, expenses, and other metrics—directly into the table cells. Replace the header row labels (Text, Number, Text title, etc.) with your specific financial categories, then populate the data rows with corresponding values. Duplicate the 2-slide set to add multiple periods or departments.
-
Recommended For
CFOs, finance managers, executives, and IR teams presenting quarterly or annual financial reports, investor presentations, business planning sessions, and fundraising pitches. Also suitable for M&A negotiations, board meetings, and internal management briefings requiring financial transparency.
-
Slide Structure
Each slide features a title section (TABLE with subtitle area) and two independent data tables. Each table contains a 5-row × 5-column structure: a slate-blue header row and five white data rows for entering financial information. The left ribbon banner is a fixed design element, while all table cells are fully editable.
Related Products
-

Sales and Bills Slide for Navigation App
#Financial Plans and Performance #Diagram #Income Statement
-

Sales and Profit Comparison Graph & Table – Clear Financial Analysis
#Financial Plans and Performance #Diagram #Graph
-

Sales and Profit Calculation Table – Key to Profit Management
#Financial Plans and Performance #Diagram #Income Statement
-

Transportation Business Sales and Profit Table – Financial Analysis
#Financial Plans and Performance #Diagram #Income Statement
