Diagram Slide Visualizing Business Process Characteristics
RJ0300069_12
- Last Update 05/07/2025
- File Size 0.7MB
- # of Slides 2
- File Format PPTX
- Slide Ratio 16:9
- Color
Keywords
- #Content-Based Slides
- #Design-Based Slides
- #Product/Service Introduction
- #Operational Plan
- #Diagram
- #Features
- #Business Processes
- #Cluster
- #Chain Diagram
- #16:9
- #wave diagram PowerPoint
- #process flow slide template
- #6-step connected diagram
- #business process flowchart
- #sequential workflow PowerPoint slide
About the Product
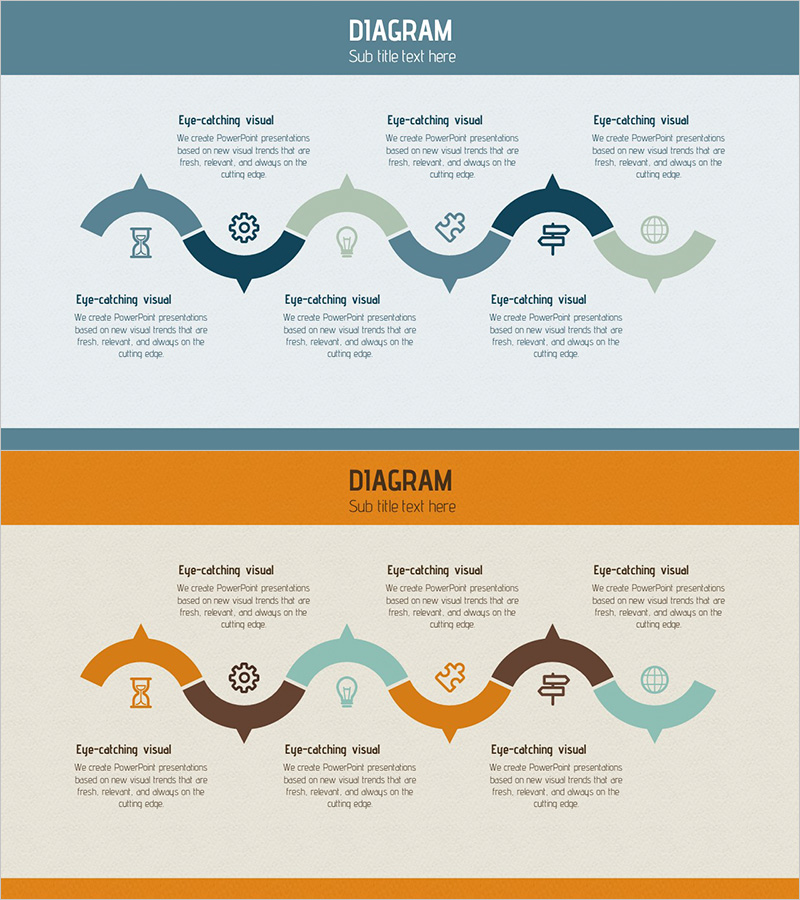
A PowerPoint slide featuring a wave-form curved diagram that visualizes business process flows across six sequential stages. Each node is connected by smooth wave lines, creating a continuous flow representation. The design uses teal, orange, and brown color palettes with embedded icons to distinguish information hierarchy and stage characteristics. This presentation template is ready to use in business proposals, strategy documents, project reports, and operational presentations for process explanation, workflow mapping, and step-by-step strategy visualization.
Usage Points
-
Main Usage
Visualizes sequential workflows, project phases, and strategic processes across six distinct stages. Each node accommodates text and icons to highlight stage-specific content, while wave-form connectors emphasize relationships and continuity between phases.
-
How to Use
Insert stage names, descriptions, and icons into each wave-form section to complete the process flowchart. The balanced top-bottom layout accommodates all six stages, making it ideal for business plans, marketing strategies, and operational reports requiring process visualization.
-
Recommended For
Executives, project managers, strategists, and marketing professionals presenting workflow processes, project timelines, and strategic phases. Suitable for business proposals, pitch decks, investor presentations, operational reports, and training materials.
-
Slide Structure
Two-slide set. First slide features teal, gray, and green wave-form 6-step diagram. Second slide presents the same structure in orange, brown, and teal tones. Six icons (hourglass, gear, lightbulb, puzzle, signpost, globe) represent stage characteristics and are positioned at each node.
Related Products
-

Animal and Plant Connection Diagram - Connecting Nature and Life
#Product/Service Introduction #Operational Plan #Diagram
-

Step-by-step Business Process Diagram – Effective Business Strategy
#Product/Service Introduction #Business Strategy #Diagram
-

Work and Service Execution Process Diagram
#Operational Plan #Technical Approach #Diagram
-

Science Experiment Schedule Connection Diagram
#Business Strategy #Operational Plan #Diagram
