User Gender Ratio Analysis – Market Insights
RJ0300069_5
- Last Update 05/07/2025
- File Size 0.7MB
- # of Slides 2
- File Format PPTX
- Slide Ratio 16:9
- Color
Keywords
- #Content-Based Slides
- #Design-Based Slides
- #Market and Competitor Analysis
- #Graph
- #Customer Analysis
- #Market Analysis
- #Horizontal Bar
- #Horizontal Bar Chart
- #16:9
- #gender ratio analysis PowerPoint
- #horizontal bar chart slide
- #market research presentation
- #customer analysis template
- #data comparison chart
About the Product
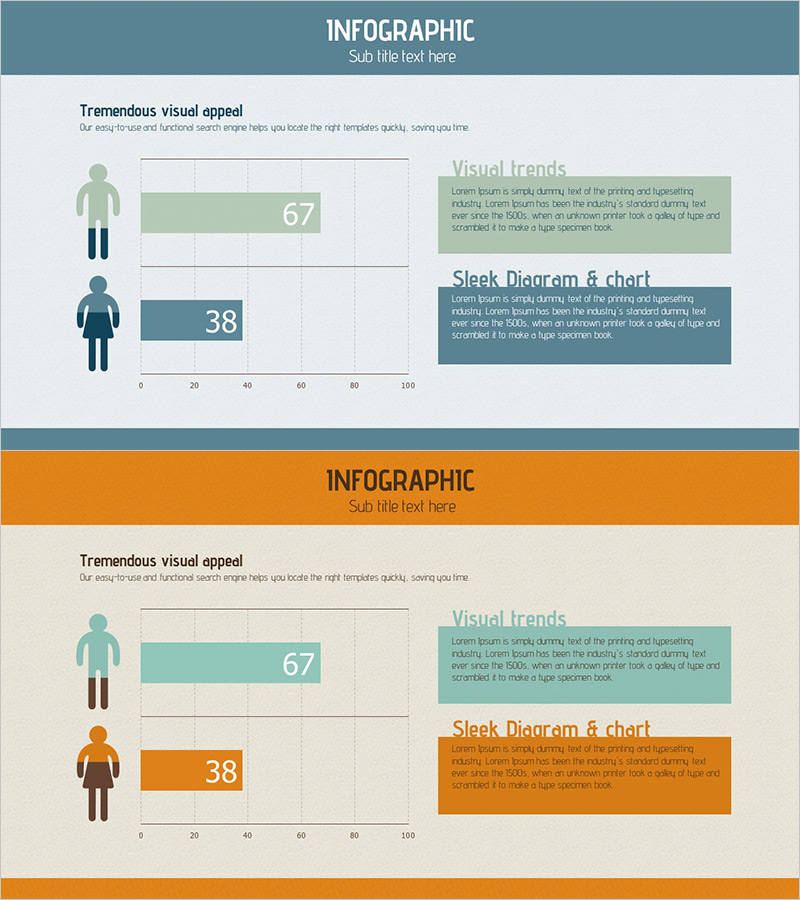
A PowerPoint slide designed for market research and customer analysis presentations featuring gender ratio visualization. The horizontal bar chart uses teal and dark blue colors to distinguish between male and female data, displaying numerical values (67, 38) alongside human silhouette icons for intuitive comparison. The right side includes a text box area for adding detailed insights and analysis commentary. The 2-slide set offers multiple color combinations (teal-blue and teal-orange) to match your presentation theme. Fully editable in PPTX format, allowing you to customize all numerical data and text content to fit your specific analysis needs.
Usage Points
-
Main Usage
Visualizes gender-based data comparisons in market research, customer segmentation, and competitive analysis. The horizontal bar chart format displays two groups side-by-side for clear numerical comparison, while human icons provide intuitive gender differentiation.
-
How to Use
Replace the sample values (67, 38) with your actual data and add analysis text in the right-side text box. Choose between two color schemes (teal-blue or teal-orange) to match your presentation's visual style and design theme.
-
Recommended For
Marketing professionals, market research analysts, sales strategists, and business executives preparing customer segmentation reports, market insights presentations, and competitive analysis documents.
-
Slide Structure
2-slide set with consistent layout: left side features two human silhouette icons and a horizontal bar chart (0-100 scale), right side contains a text explanation area. Slide 1 uses teal-blue color scheme, Slide 2 uses teal-orange, providing visual variety for multi-slide presentations.
Related Products
-

Customer and Market Analysis Slide – Yellow and Bluegreen Emotion
#Market and Competitor Analysis #Graph #Other
-

Space Industry Analysis Graph Chart – Market and Competitive Analysis
#Market and Competitor Analysis #Graph #Customer Analysis
-

Market Demand Analysis PowerPoint Slide – Donut Chart Layout
#Market and Competitor Analysis #Graph #Customer Analysis
-

Performance Analysis 3D Bar Chart & Table – Market and Performance Analysis
#Company Introduction #Market and Competitor Analysis #Diagram
