Comparative Analysis Vertical Bar Chart – Market and Competitor Analysis
RJ0300069_26
- Last Update 05/07/2025
- File Size 0.7MB
- # of Slides 2
- File Format PPTX
- Slide Ratio 16:9
- Color
Keywords
- #Content-Based Slides
- #Design-Based Slides
- #Market and Competitor Analysis
- #Graph
- #Competitor Analysis
- #Market Analysis
- #Column
- #Grouped Column
- #16:9
- #vertical bar chart PowerPoint
- #comparative analysis slide template
- #market analysis graph
- #competitor analysis chart
- #data comparison presentation
- #grouped column chart template
About the Product
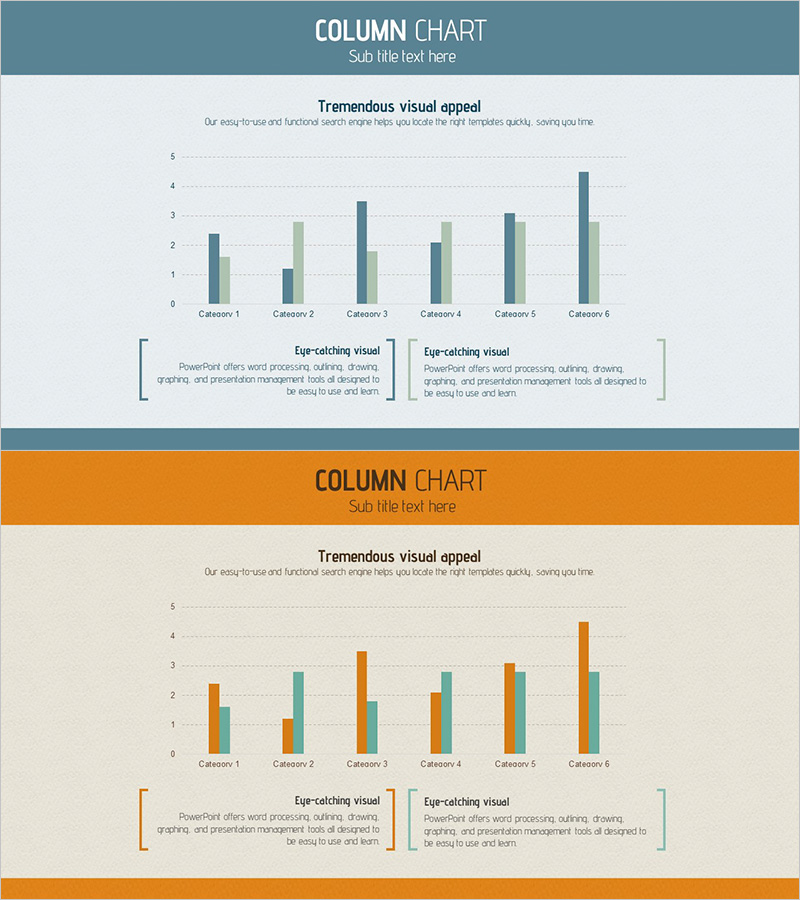
A vertical bar chart PowerPoint slide optimized for market analysis and competitor comparison. This presentation template displays data for 6 categories with 2 data series positioned side-by-side, enabling quick visual comparison of numerical differences and trends across items. The dual-color scheme (slate blue and orange) clearly distinguishes the two data series, while gridlines and legend enhance readability. Two text boxes at the bottom allow you to add key insights and strategic takeaways. The 2-slide set provides multiple color variations (slate blue and orange versions) so you can select the combination that best matches your corporate branding guidelines.
Usage Points
-
Main Usage
This slide is designed to compare your company's numerical performance against competitors across metrics such as market size, market share, and growth rate. By placing 2 data series across 6 categories, it effectively displays both numerical differences and trends, making it ideal for presentations that require audience comprehension of comparative data.
-
How to Use
Enter your analysis topic in the title area at the top (e.g., Market Size Comparison, Customer Satisfaction Analysis). Input the 6 category names and corresponding data values for each series into the chart. Use the two text boxes at the bottom to add derived insights or strategic implications that clarify your data interpretation.
-
Recommended For
Ideal for strategy planning, marketing, and sales departments presenting market updates, competitive analysis, and quarterly performance comparisons. Particularly effective in investor presentations, executive briefings, and client proposals where data-driven arguments require objective visual support.
-
Slide Structure
Slide 1: Slate blue header, 6-category vertical bar chart with 2 data series (slate blue and gray bars), legend, and 2 text boxes at bottom. Slide 2: Orange header with identical chart structure (orange and teal bars). Both slides in 16:9 aspect ratio, fully editable PPTX format.
Related Products
-

Competitor Brand Product Comparison Analysis Graph
#Market and Competitor Analysis #Graph #Competitor Analysis
-

Vertical Bar Chart for Future Growth Prediction – Innovative Vision
#Market and Competitor Analysis #Graph #Competitor Analysis
-

Grouped Bar Chart for Learning Categories
#Market and Competitor Analysis #Graph #Competitor Analysis
-

Marketing and Analysis Presentation Template – Professional Data Visualization Design
#Market and Competitor Analysis #Graph #Competitor Analysis
