Production Volume Analysis Graph – Market Competition Insight
RJ0300069_13
- Last Update 05/07/2025
- File Size 0.7MB
- # of Slides 2
- File Format PPTX
- Slide Ratio 16:9
- Color
Keywords
- #Content-Based Slides
- #Design-Based Slides
- #Market and Competitor Analysis
- #Diagram
- #Graph
- #Competitor Analysis
- #Competitive Advantage
- #16:9
- #production volume analysis chart PowerPoint
- #area chart template
- #market competition analysis slide
- #production data comparison PPT
- #competitive analysis graph
About the Product
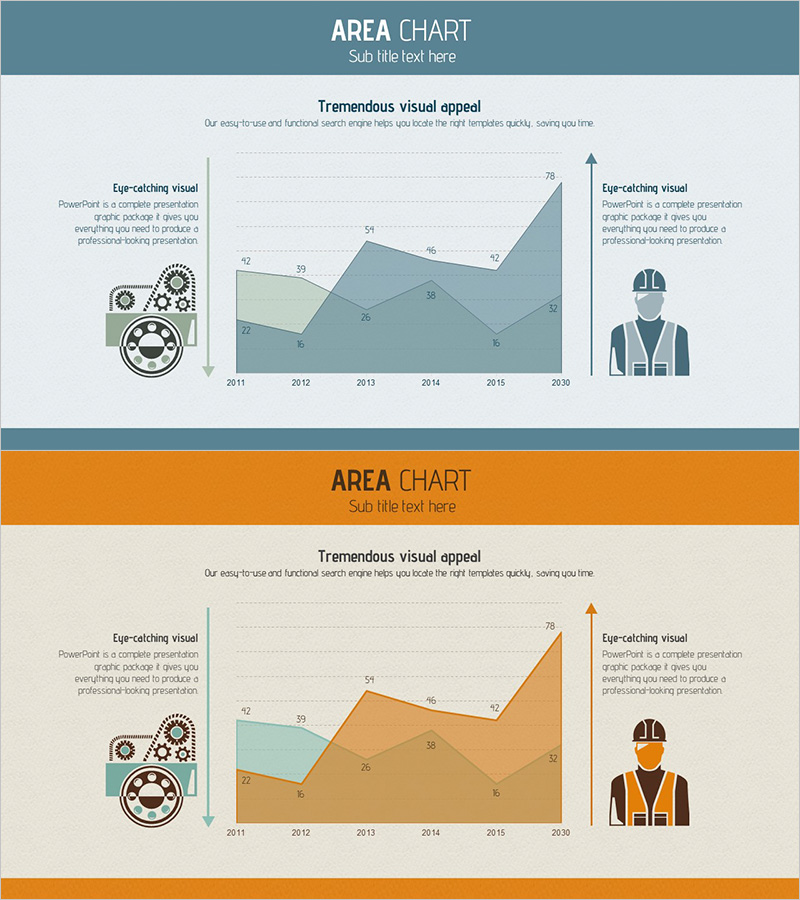
A PowerPoint slide visualizing production volume trends using an area chart format. The slide displays data from 2011 to 2030 in two distinct layers—teal and orange—enabling direct comparison of market share changes against competitors. The left side features gear and worker icons to reinforce production concepts, while the right side includes a safety-helmeted worker icon to enhance industrial authenticity. Designed in 16:9 widescreen format with 2-slide composition, this template is ready for immediate use in business presentations, annual reports, and market analysis documents.
Usage Points
-
Main Usage
Visualizes production volume data trends over time using an area chart, clearly communicating market share changes relative to competitors. Designed for business reports, investor presentations, and executive briefings to demonstrate production capacity and competitive market position at a glance.
-
How to Use
Replace the chart data with your actual production volume figures. Enter production background and strategy in the left text area, and insert market insights in the right text boxes. Adjust colors and icons based on presentation context to reflect industry-specific characteristics.
-
Recommended For
Ideal for executives, marketing professionals, and business development teams in manufacturing, chemicals, automotive, electronics, and energy sectors preparing market competition analysis materials. Perfect for quarterly and annual business reports, investor presentations, and competitive benchmarking presentations.
-
Slide Structure
Two-slide composition featuring the first slide in teal tone and the second in orange tone, both with identical structure. Each slide contains a left icon area (gears, worker, or safety-helmeted figure), a central chart area with 6 data points, and two right-side text boxes for contextual information.
Related Products
-

Dawn City Theme Competitor Analysis Graph – Understanding Market Trends
#Market and Competitor Analysis #Diagram #Graph
-

Comparison Graph of Yearly Trends – Market and Competitor Analysis
#Market and Competitor Analysis #Diagram #Graph
-

Blue Green Graph Numerical Change Analysis – Ideal for Market and Competitive Analysis Presentation
#Market and Competitor Analysis #Diagram #Graph
-

Horizontal Bar Chart for Competitive Advantage Analysis – Sea Lighthouse
#Market and Competitor Analysis #Diagram #Graph
