Manufacturing Donut Circle Chart – Visual Data Representation
RJ0300069_16
- Last Update 05/07/2025
- File Size 0.8MB
- # of Slides 2
- File Format PPTX
- Slide Ratio 16:9
- Color
Keywords
- #Content-Based Slides
- #Design-Based Slides
- #Product/Service Introduction
- #Business Introduction
- #Graph
- #Development Status
- #Technological Status
- #Circles
- #Doughnut Chart
- #16:9
- #donut chart PowerPoint slide
- #pie chart template
- #ratio data visualization
- #2-segment donut graph
- #data presentation slide
- #PowerPoint chart design
About the Product
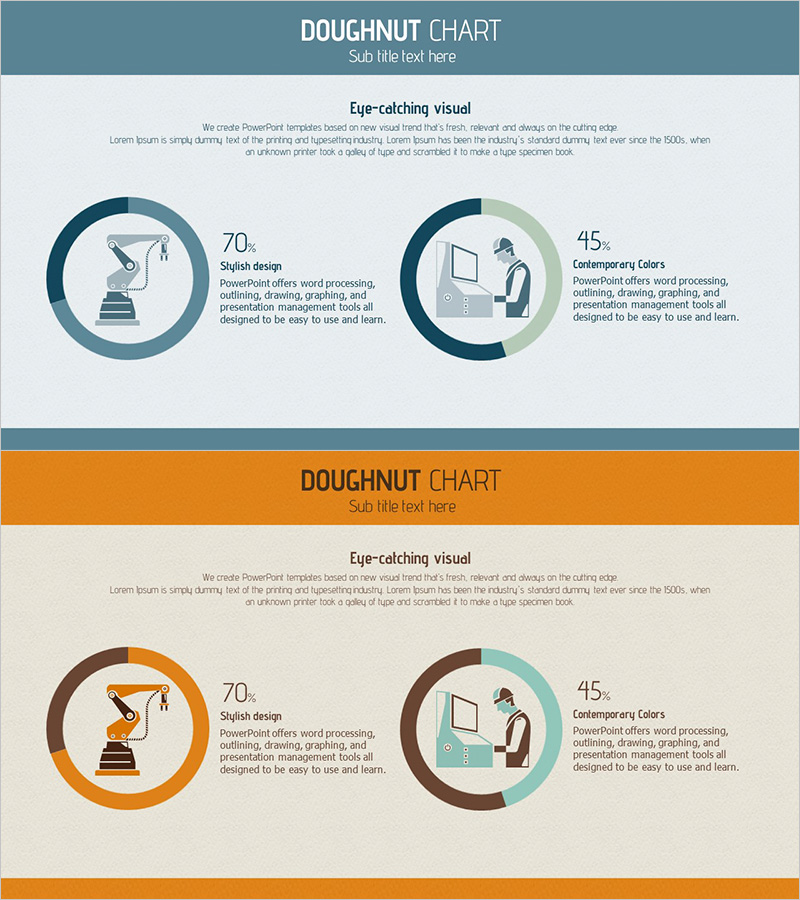
A 2-slide donut chart PowerPoint template featuring dual-segment circular graphs with contrasting teal and sage green color schemes. Each segment displays percentage values in the center circle, with accompanying icons and descriptive text positioned to the right. This design effectively combines quantitative data with qualitative information, making it ideal for presentations, reports, and slide decks. The template is optimized for 16:9 widescreen format and ready for immediate customization and use.
Usage Points
-
Main Usage
Visualize quantitative ratio data with clarity and impact using this donut chart slide template. Ideal for presenting market share, budget allocation, customer satisfaction distribution, composition percentages, and any scenario requiring emphasis on parts relative to the whole.
-
How to Use
Replace percentage values with your actual data, customize icons and descriptive text to match your presentation topic, and adjust colors if needed. Suitable for financial reports, market analysis, customer segmentation, operational reviews, and executive briefings.
-
Recommended For
Manufacturing and distribution industry reports, marketing team presentations on market share, finance team budget composition analysis, sales team customer distribution insights, executive management reports, and any business presentation requiring quantitative data emphasis.
-
Slide Structure
2-slide set with dual donut charts per slide. Each segment uses contrasting colors (teal, sage green, brown) for clear differentiation. Percentage values (70%, 45%, etc.) centered in each donut. Icons and descriptive text positioned right of each segment. Optimized for 16:9 widescreen display.
Related Products
-

Cat Donut Chart – Data Analysis and Creativity
#Product/Service Introduction #Business Introduction #Diagram
-

Mobile App Service Development Status – Doughnut Chart Visualization
#Product/Service Introduction #Business Introduction #Graph
-

Visualizing Business Development Status with Donut Chart Slide
#Product/Service Introduction #Business Introduction #Graph
-

Analysis of Social Media Cloud Development Status – Stylish Donut Chart
#Product/Service Introduction #Business Introduction #Graph
