User Analysis Graph by Year – Insights into Customer Behavior
RJ0300069_4
- Last Update 05/07/2025
- File Size 2.3MB
- # of Slides 2
- File Format PPTX
- Slide Ratio 16:9
- Color
Keywords
- #Content-Based Slides
- #Design-Based Slides
- #Market and Competitor Analysis
- #Graph
- #Other
- #Customer Analysis
- #Market Analysis
- #Circles
- #Doughnut Chart
- #16:9
- #donut chart PowerPoint slide
- #pie chart template
- #percentage comparison
- #user analysis graph
- #data visualization slide
- #how to create donut chart in PowerPoint
About the Product
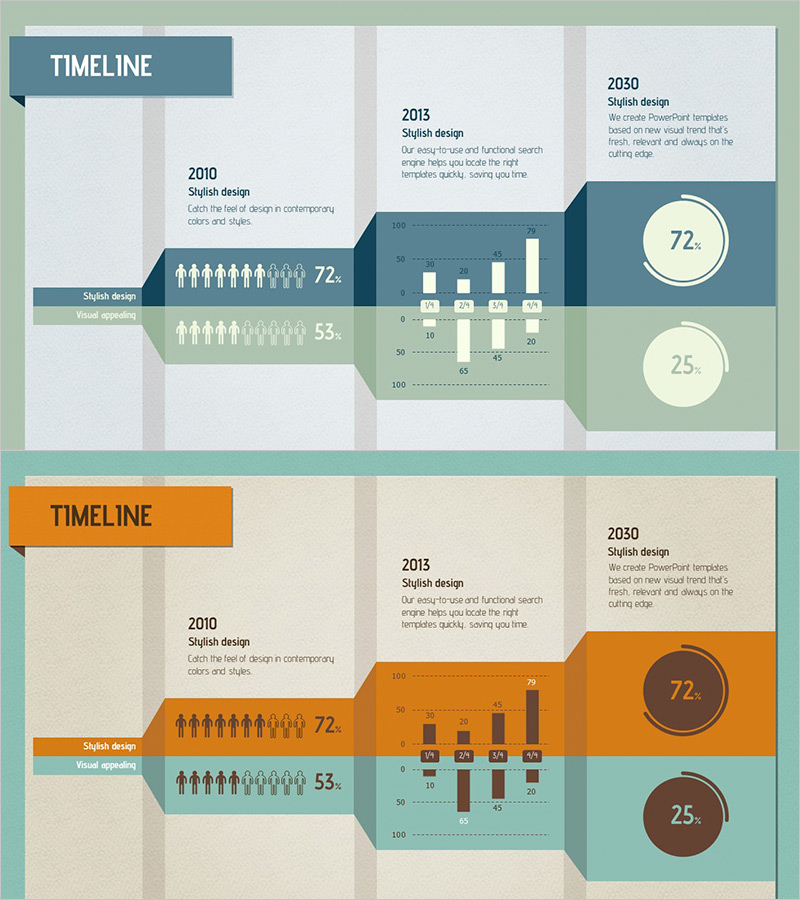
A donut chart PowerPoint slide template for visualizing year-over-year user analysis and customer insights. The design features a two-tone color scheme with teal and beige backgrounds, displaying 72% and 25% proportions across two independent donut charts. Complementary bar graphs and infographic elements enhance data comprehension for business presentations. This 16:9 widescreen, 2-slide PPTX template is fully editable and ready for immediate use in market analysis, competitive benchmarking, and customer behavior reports.
Usage Points
-
Main Usage
Visualize compositional data such as user demographics, market share percentages, customer segment distribution, and year-over-year performance metrics using donut chart design. Two independent charts enable simultaneous comparison of different data categories or temporal trends.
-
How to Use
Insert into business reports, marketing proposals, and investor pitch decks within customer insights or market analysis sections. Replace sample percentages with your actual data, add legend labels and descriptive text to enhance audience comprehension. The accompanying bar graph allows for multi-layered data storytelling.
-
Recommended For
Marketing managers, business analysts, executives preparing performance reports, and market researchers presenting customer behavior analysis, sales comparisons, and market segmentation data. Particularly effective when emphasizing percentage shifts between two time periods or categories.
-
Slide Structure
Two-slide layout: Slide 1 features a teal background with user icons and 72% donut chart; Slide 2 displays a beige background with 25% donut chart. Each slide includes supporting bar graph and numerical data fields for comprehensive comparative analysis.
Related Products
-

User Analysis Donut Chart – Optimal for Market and Competitor Analysis
#Market and Competitor Analysis #Graph #Other
-

Work Performance Analysis Graph – Visually Representing Employee Performance
#Market and Competitor Analysis #Graph #Other
-

Shopping Mall User Gender Ratio Analysis Chart
#Market and Competitor Analysis #Graph #Other
-

Separate Recycling Implementation Rate Survey Donut Chart – Visualized in Blue and Green
#Market and Competitor Analysis #Graph #Customer Analysis
