Visualizing Logistics Business Process with Diagram Slide
RJ0300069_15
- Last Update 05/07/2025
- File Size 0.7MB
- # of Slides 2
- File Format PPTX
- Slide Ratio 16:9
- Color
Keywords
- #Content-Based Slides
- #Design-Based Slides
- #Product/Service Introduction
- #Operational Plan
- #Diagram
- #Differentiation Strategy for Products/Services
- #Business Processes
- #Cluster
- #Chain Diagram
- #16:9
- #connected process diagram PowerPoint
- #business process flow slide
- #4-stage logistics diagram
- #workflow visualization PPT
- #arrow diagram template
About the Product
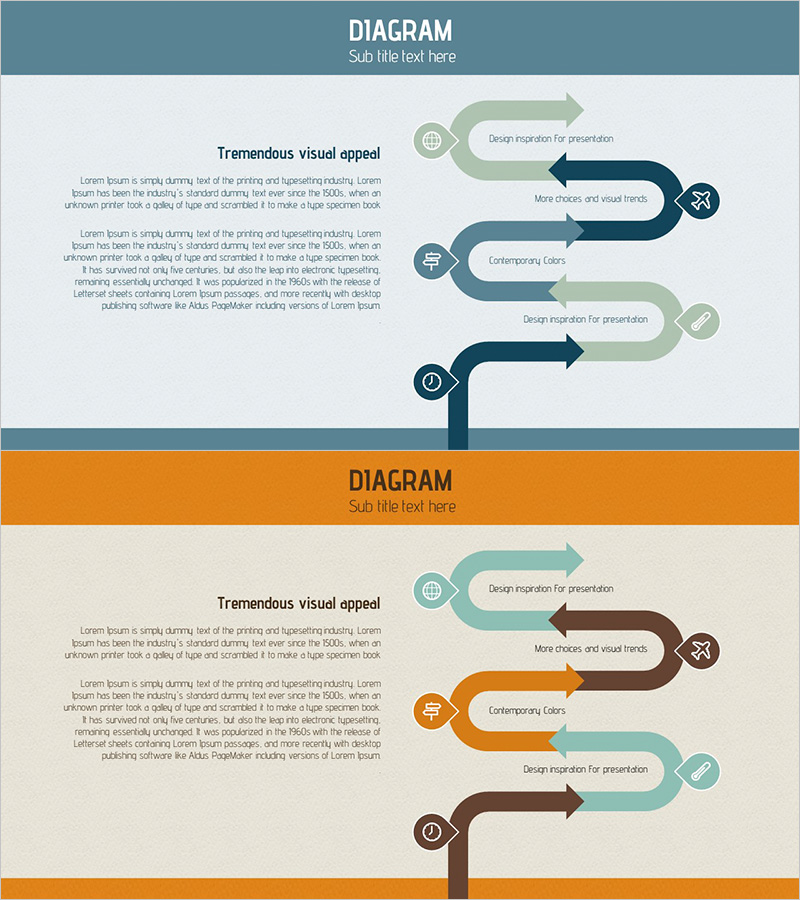
A PowerPoint slide that visualizes logistics and business processes through a 4-stage connected diagram. Each stage is clearly represented with arrows and circular icons, using three color schemes—teal, orange, and brown—to emphasize stage differentiation. The 2-slide set provides the same layout with different color combinations, allowing you to select the version that matches your presentation's tone. Immediately applicable to operations planning, service differentiation, and workflow explanation sections. Ample text input areas enable free editing of process stage names and descriptions.
Usage Points
-
Main Usage
Visualizes logistics and business operational processes stage-by-stage to clearly communicate workflow within your organization. Arrow connections between stages express sequential progression intuitively. Effectively explains operational systems to executives, team members, and external partners.
-
How to Use
Use in business plan or operations planning sections when explaining core process stages. Customize by entering specific task names, responsible departments, and timeframes into each stage's text box. Select the color combination that matches your presentation's overall design tone and insert into your deck.
-
Recommended For
Logistics and supply chain managers, operations directors, business process improvement specialists, consultants, and training instructors use this for workflow explanations. Suitable for business proposals, management reports, organizational restructuring presentations, and process improvement discussions.
-
Slide Structure
2-slide set. Each slide features a left-side process flow area with 4 nodes (circular icons) and 3 connecting arrows, paired with a right-side text explanation area. Framed by a colored header (teal or orange) and footer. Slide 1 uses teal and brown tones; Slide 2 uses orange and brown tones for color variation.
Related Products
-

Business Service Differentiation Strategy – Diagram for Successful Operations
#Product/Service Introduction #Operational Plan #Diagram
-

Diet Consulting and Strategies PowerPoint Slide – Practical Approach
#Product/Service Introduction #Operational Plan #Diagram
-

Successful Business Strategy Diagram
#Product/Service Introduction #Operational Plan #Diagram
-

Creative Connection Diagram – Product and Service Differentiation Strategy
#Product/Service Introduction #Operational Plan #Diagram
