Market Analysis Visualization with Horizontal Bar Graph – Harmony of Teal and Orange
RJ0300069_21
- Last Update 05/07/2025
- File Size 0.7MB
- # of Slides 2
- File Format PPTX
- Slide Ratio 16:9
- Color
Keywords
About the Product
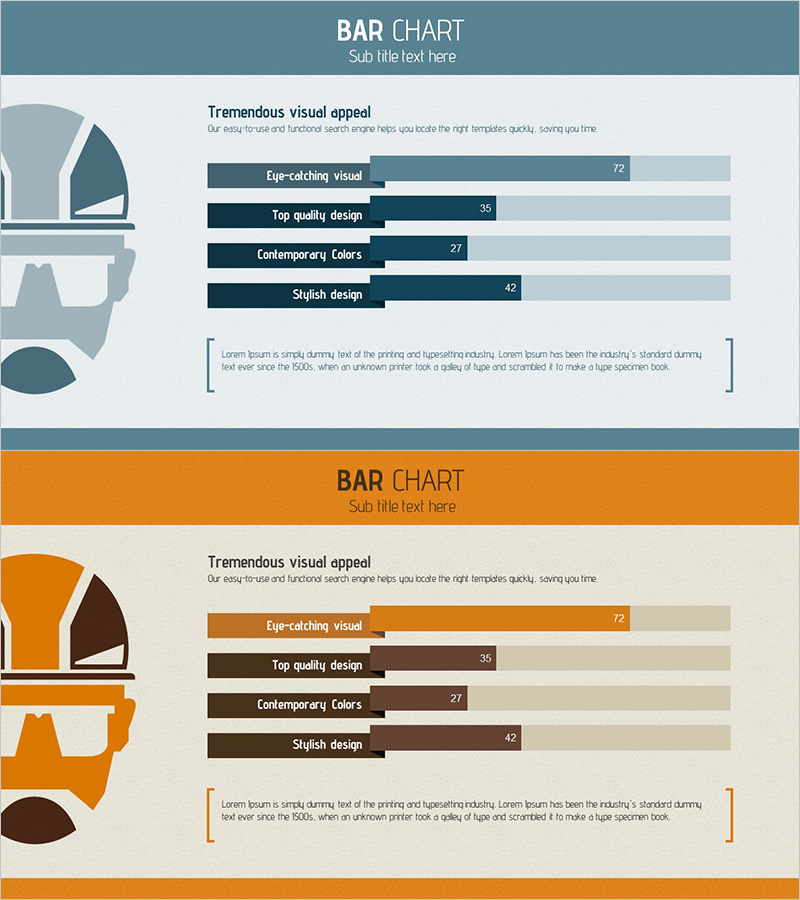
A horizontal bar chart PowerPoint slide optimized for market analysis and data comparison. This presentation template features four items represented by horizontal bars in contrasting teal and orange dual-tone colors, with numerical values clearly displayed for each category. The balanced layout combines a left-side illustration element with a right-side data visualization area, making it ready to use in business reports and presentations. The 2-slide set allows flexible data input with consistent design, formatted for 16:9 widescreen displays.
Usage Points
-
Main Usage
Visualizes numerical data for four categories using horizontal bars, ideal for market analysis, competitor comparison, performance metrics, and customer satisfaction surveys. The contrasting teal and orange color scheme emphasizes differences between items and captures audience attention during presentations.
-
How to Use
Double-click each bar and value to edit the data, and modify item labels to match your dataset. The left-side illustration can be retained as a background element or removed as needed. Colors are fully customizable to align with corporate branding. Use the 2-slide set to repeat the same design for multiple data visualizations.
-
Recommended For
Marketing plans, business reports, investor presentations, quarterly performance reviews, and market research findings. Suitable for sales teams comparing performance metrics, product development teams analyzing technical indicators, and executive-level strategic planning meetings.
-
Slide Structure
Each slide features a header area (title and subtitle), a left-side illustration (abstract design elements), and a right-side data section with four horizontal bars and numerical labels. Bars are color-coded in teal (top two items) and orange (bottom two items), with values displayed at the bar ends. A description text area at the bottom accommodates additional information.
Related Products
-

Market Outlook Insights with Bar Graph – Visualizing Business Performance
#Market and Competitor Analysis #Graph #Future Outlook
-

Performance Analysis 3D Bar Chart & Table – Market and Performance Analysis
#Company Introduction #Market and Competitor Analysis #Diagram
-

Successful Business Future Outlook Analysis Graph
#Market and Competitor Analysis #Diagram #Graph
-

Market Demand Analysis PowerPoint Slide – Donut Chart Layout
#Market and Competitor Analysis #Graph #Customer Analysis
