Progress Status Order Circle Graph – Visualizing Project Progress
RJ0300069_28
- Last Update 05/07/2025
- File Size 0.7MB
- # of Slides 2
- File Format PPTX
- Slide Ratio 16:9
- Color
Keywords
- #Content-Based Slides
- #Design-Based Slides
- #Product/Service Introduction
- #Business Introduction
- #Diagram
- #Graph
- #Development Status
- #Technological Status
- #Flow
- #Circles
- #Linear Flow
- #Doughnut Chart
- #16:9
- #doughnut chart PowerPoint
- #progress visualization slide
- #3-stage pie chart template
- #project status PowerPoint slide
- #circular chart presentation template
About the Product
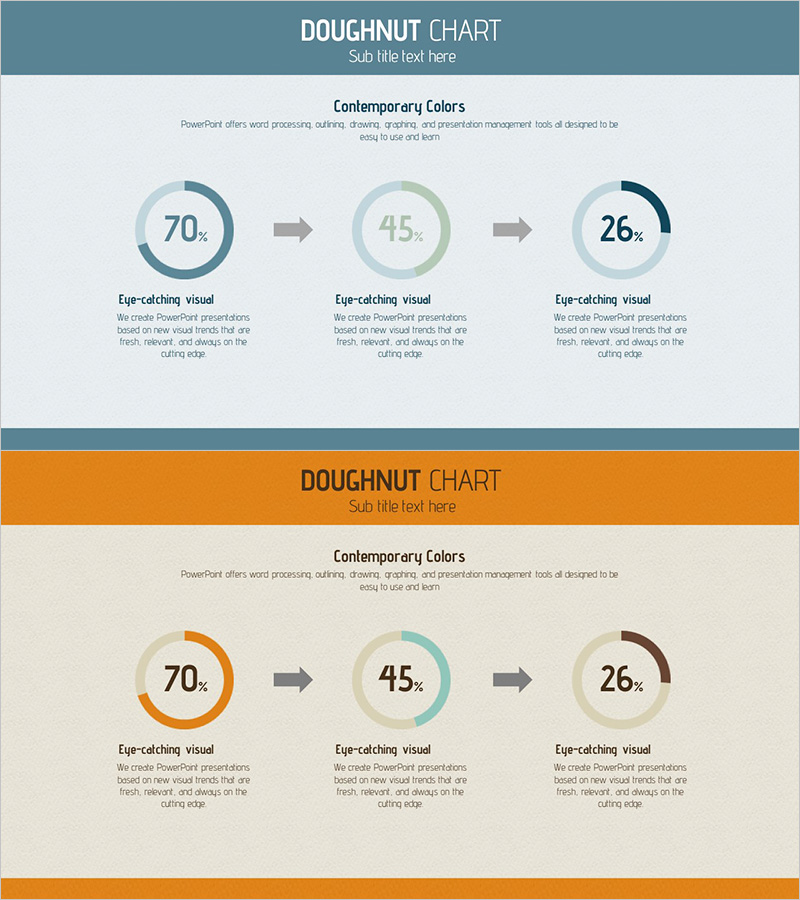
A PowerPoint slide featuring three doughnut-shaped pie charts to visualize project progress across sequential stages. The design uses teal, sage green, and navy blue color tones with percentage values (70%, 45%, 26%) and descriptive text beneath each chart. The 2-slide template includes a header section and content area with clear visual hierarchy, making it ready for immediate use in project reports, status presentations, and technical progress updates. Provided in 16:9 widescreen PPTX format.
Usage Points
-
Main Usage
Display project, task, or technical progress across multiple stages using doughnut-shaped pie charts. Each circular chart represents an independent progress phase with percentage completion rates, enabling stakeholders to quickly assess overall advancement and completion status.
-
How to Use
Insert this slide in the project status section of your presentation or use it for weekly and monthly progress reports. Edit the percentage values and labels with your actual data, then place directly into your presentation deck without additional formatting.
-
Recommended For
Ideal for project managers, team leads, and technical directors presenting progress updates. Suitable for business plans, technical status reports, quarterly performance presentations, and product development progress briefings.
-
Slide Structure
2-slide template with the first slide displaying three doughnut charts in teal, sage green, and navy blue arranged horizontally, showing 70%, 45%, and 26% progress rates. The second slide features the same chart structure with an orange header background, providing a color variation option.
Related Products
-

Cat Donut Chart – Data Analysis and Creativity
#Product/Service Introduction #Business Introduction #Diagram
-

Big Data Development Status Analysis Graph – Visualizing Business Strategy
#Product/Service Introduction #Business Introduction #Diagram
-

Technology Achievement Donut Chart
#Product/Service Introduction #Business Introduction #Graph
-

Status of Parts Production and Development – Donut Chart Infographic
#Product/Service Introduction #Business Introduction #Graph
