
Skyscrapers Presentation Template Wide – Modern and Stylish Design
J0300065
- Last Update 01/07/2025
- File Size 46.3MB
- # of Slides 30
- File Format PPTX
- Slide Ratio 16:9
- Color
Slide Preview


Keywords
About the Product
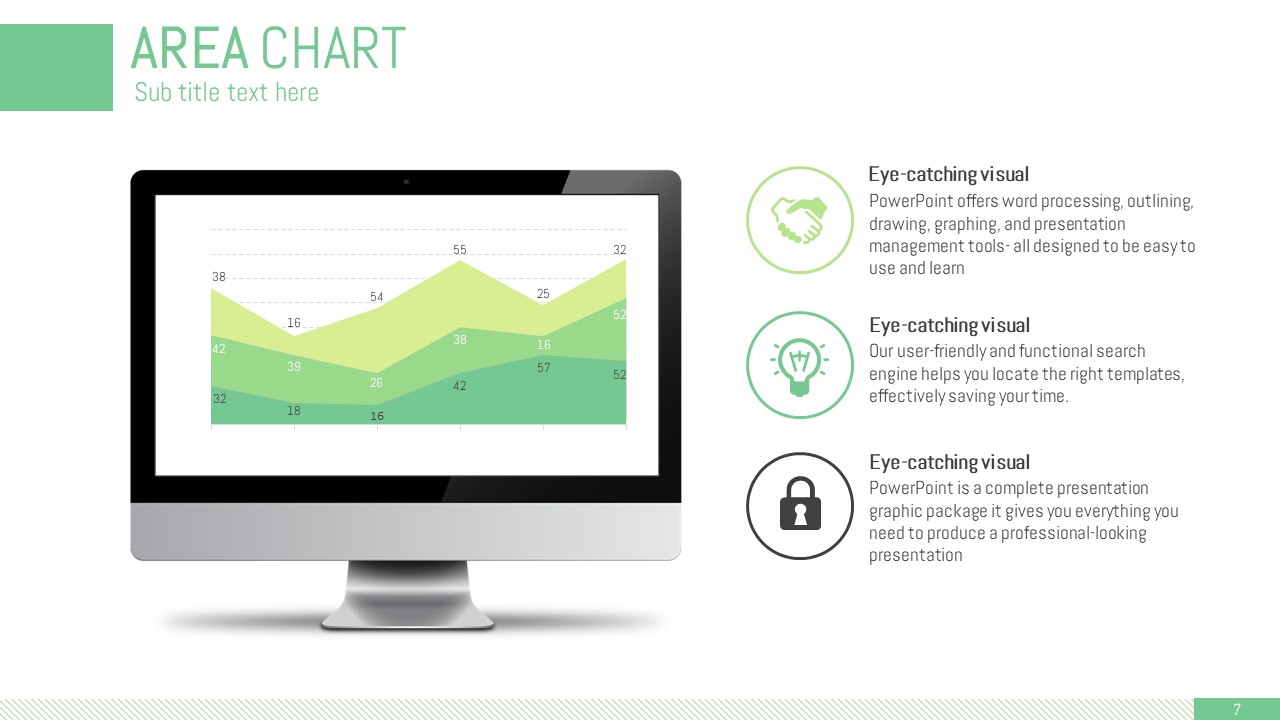
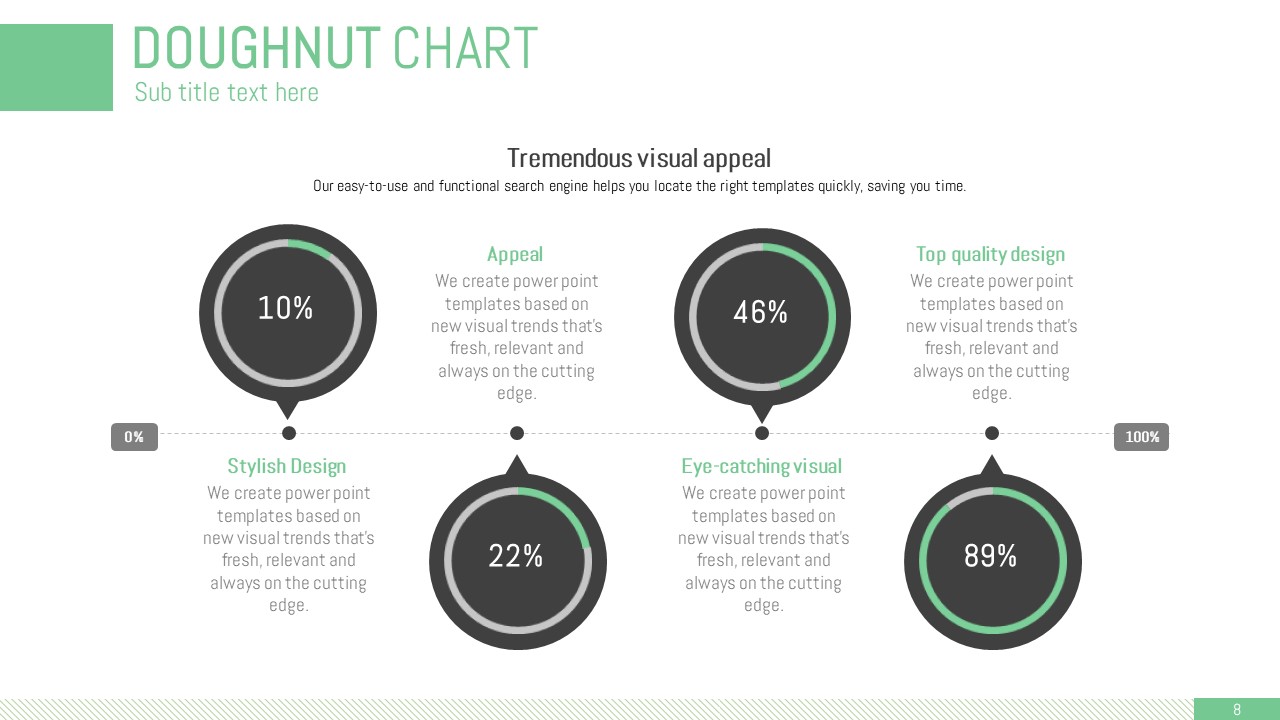
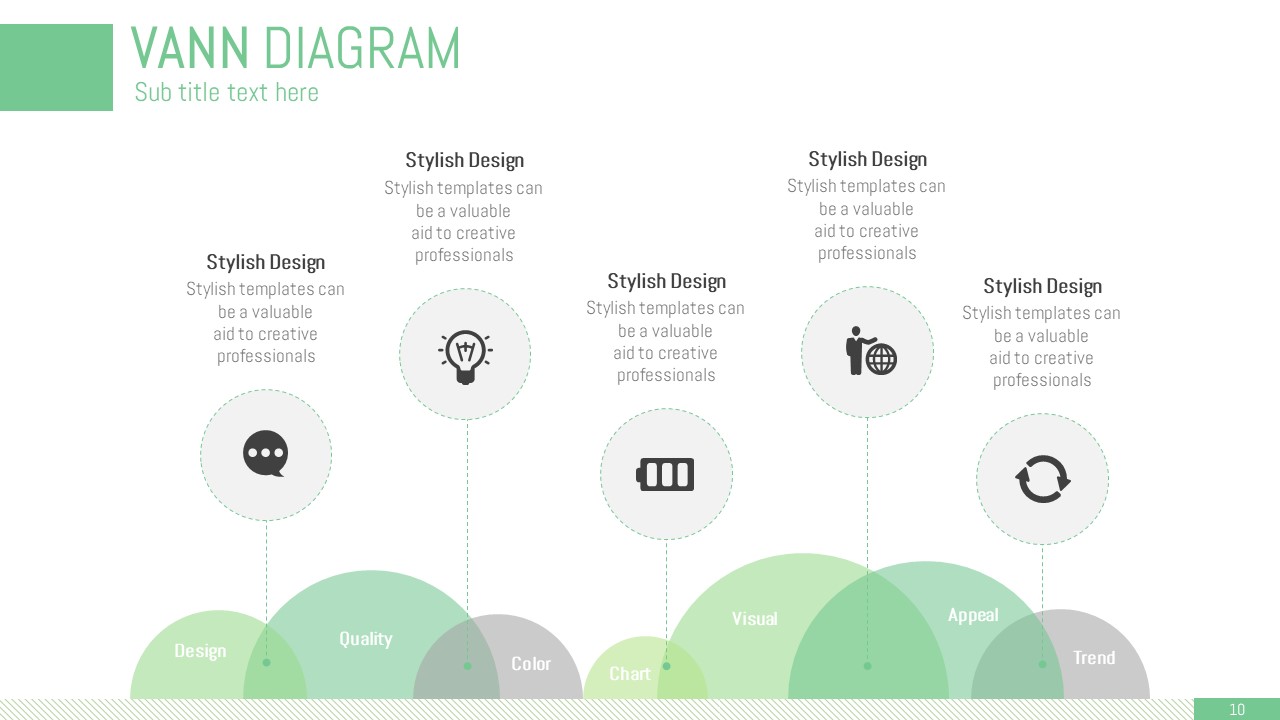
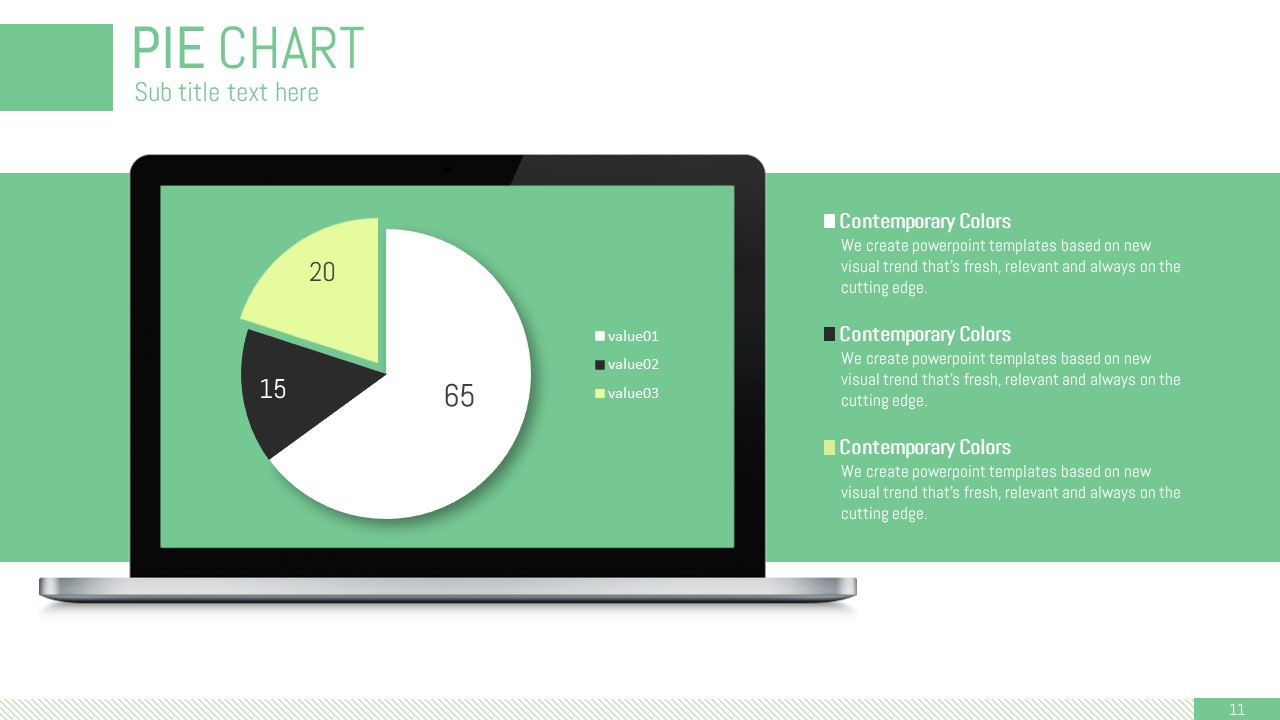
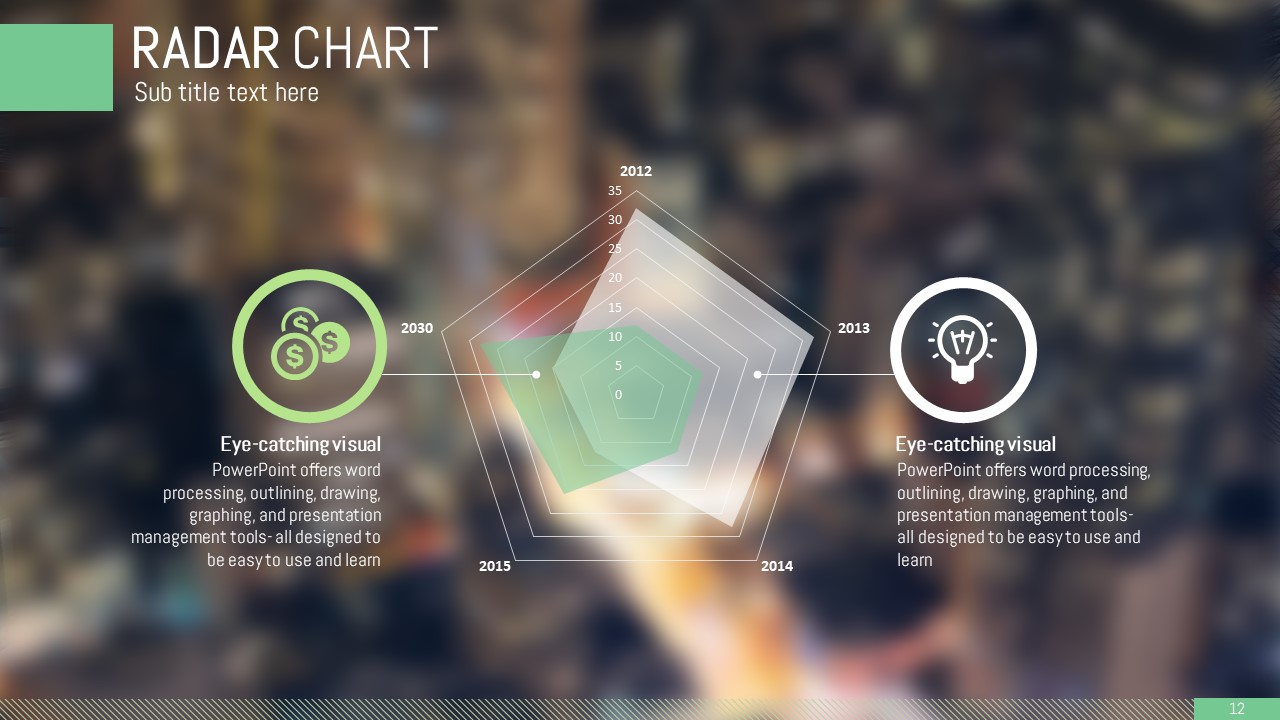
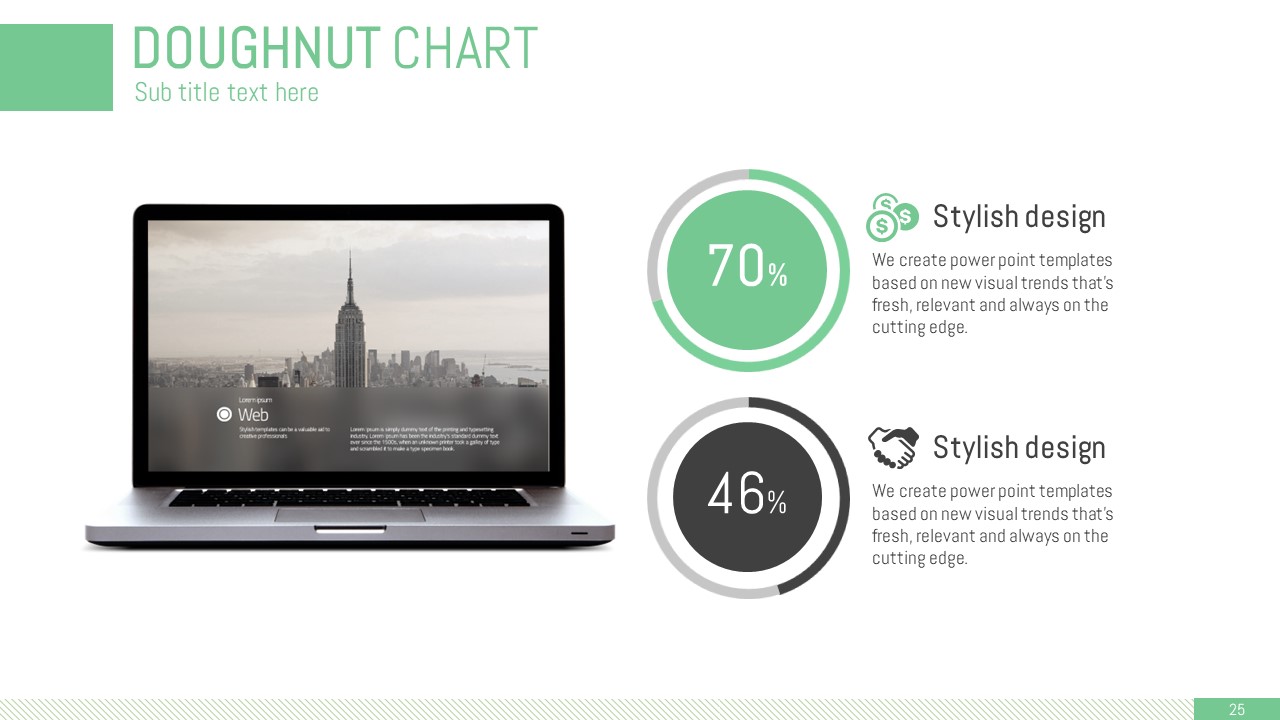
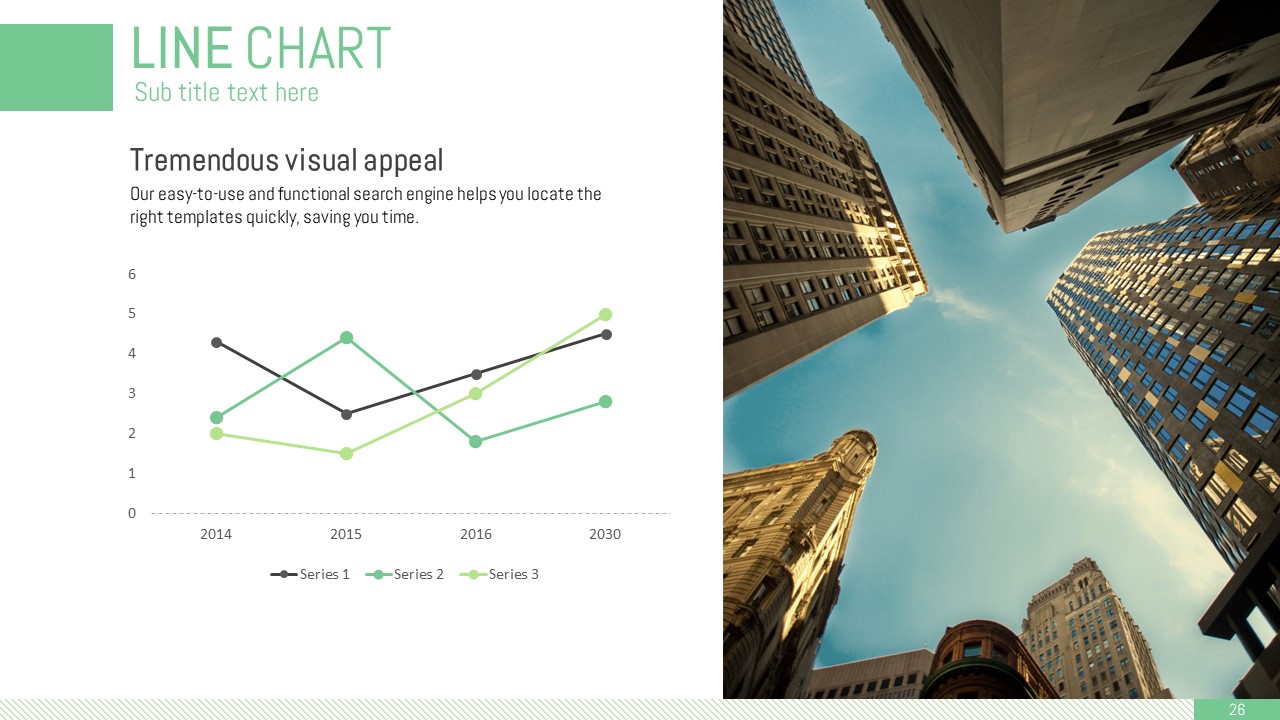
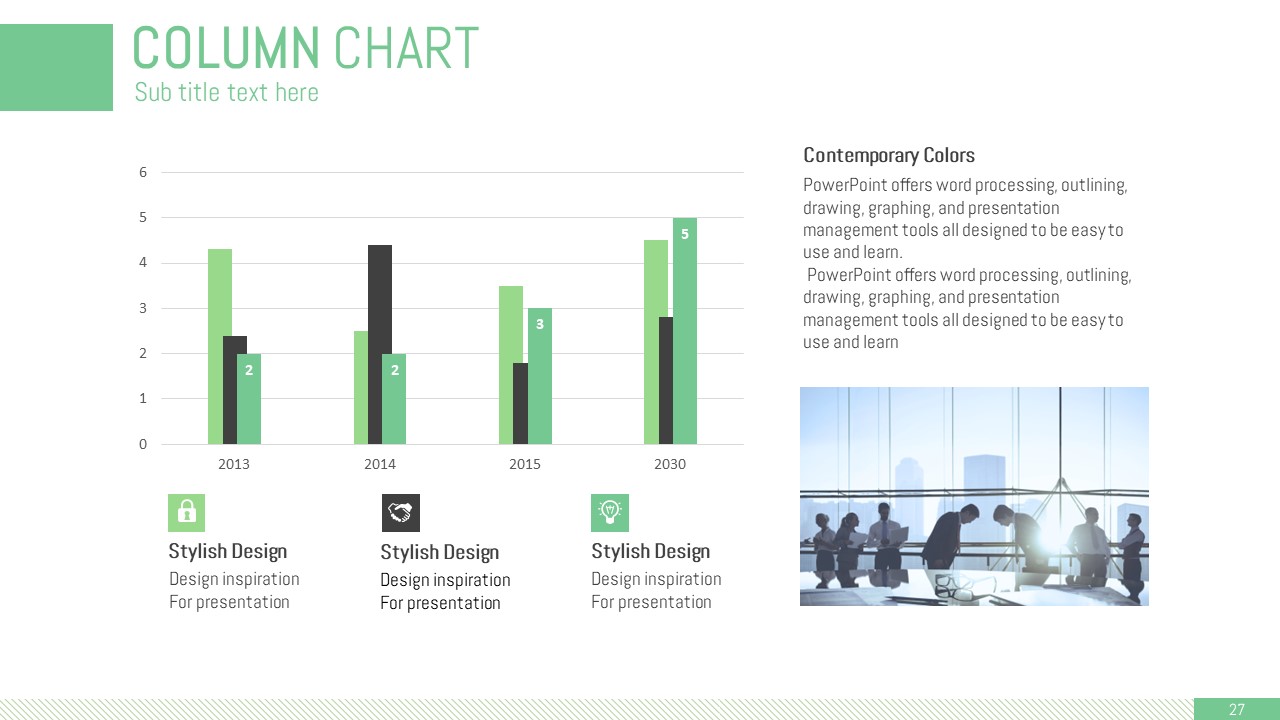
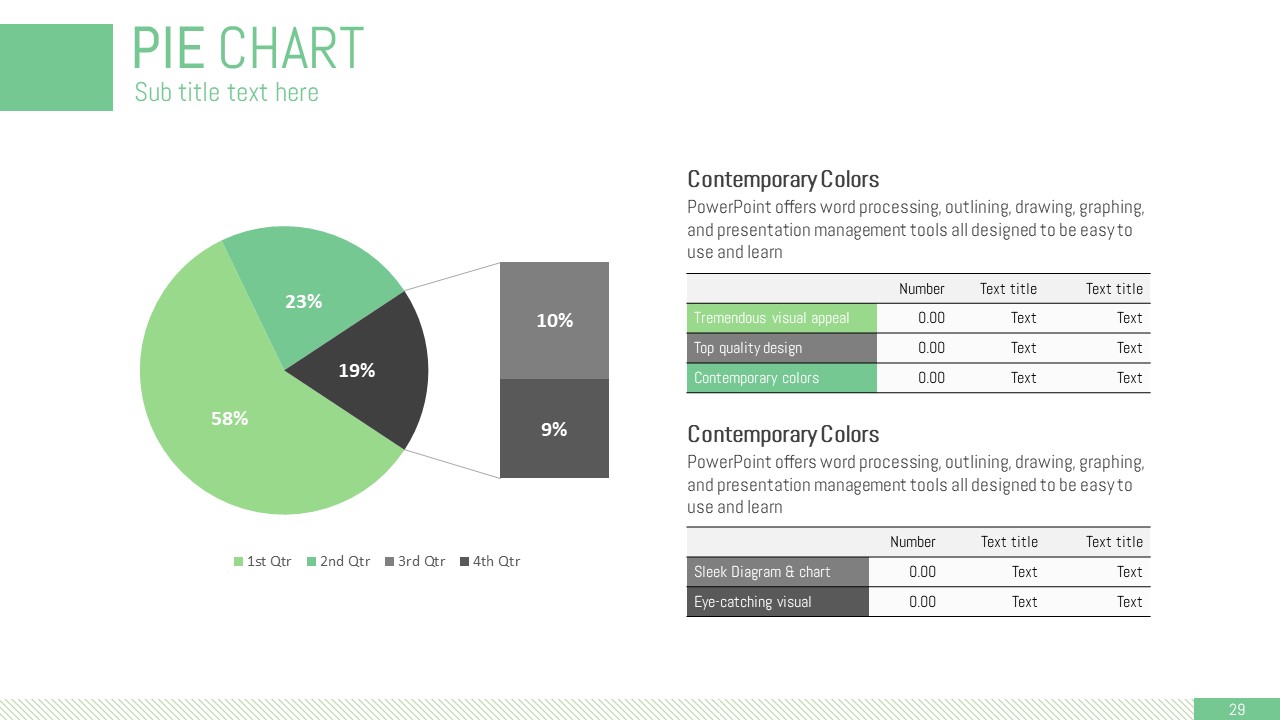
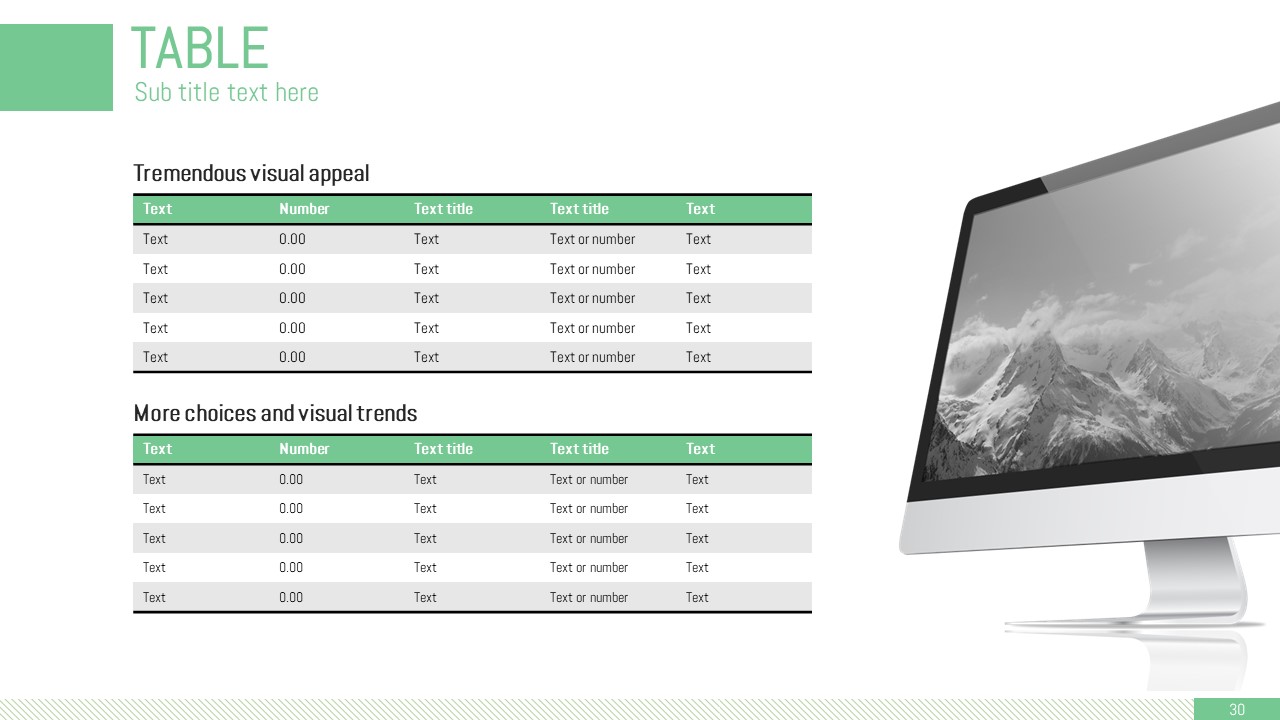
A professional business PowerPoint template featuring a dramatic city skyline double-exposure cover slide set against a dark charcoal and black background, accented with green (mint and lime) highlights. This 30-slide presentation deck is designed for corporate strategy sessions, investor pitches, and high-impact business proposals. The template includes a wide variety of data visualization slides — area chart, Venn diagram, column chart, pie chart with laptop mockup, and radar chart — making it easy to present complex data in a visually compelling way. The four-column grid layout balances information density with readability, while icon elements and photo mockups add visual depth. Provided in fully editable PPTX format, you can customize text, colors, and chart data to match your brand. The 16:9 widescreen ratio ensures crisp display on large presentation screens and projectors.
Usage Points
-
Main Usage
Ideal for corporate strategy presentations, investor pitch decks, and business proposals where a strong visual impact is required. The dark charcoal background with green accents creates a confident, authoritative tone suited for boardroom and investor settings.
-
How to Use
Open the PPTX file and replace placeholder text and chart data with your actual content. Use the area, column, pie, and radar chart slides to visualize key metrics, then customize colors and icons to align with your brand identity.
-
Recommended For
Best suited for corporate strategists, IR managers, management consultants, and startup founders who need data-driven business presentations. Particularly effective for investor meetings, board reports, and partner proposal decks.
-
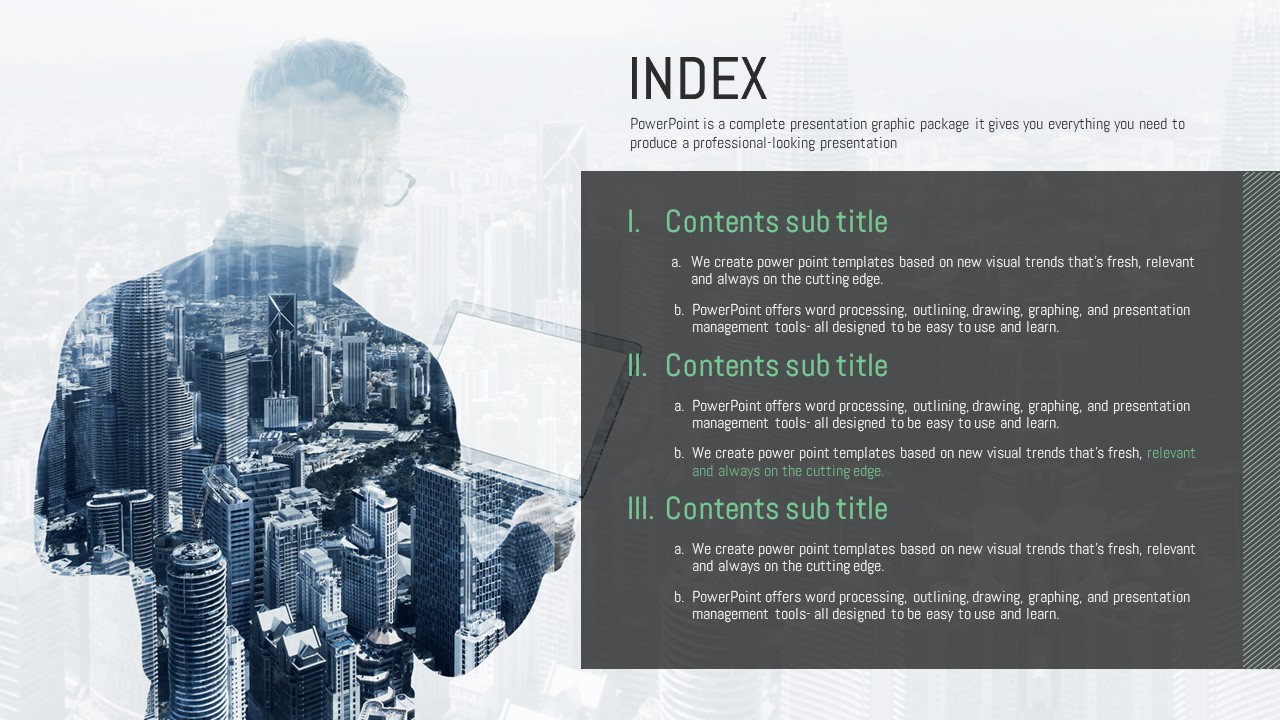
Slide Structure
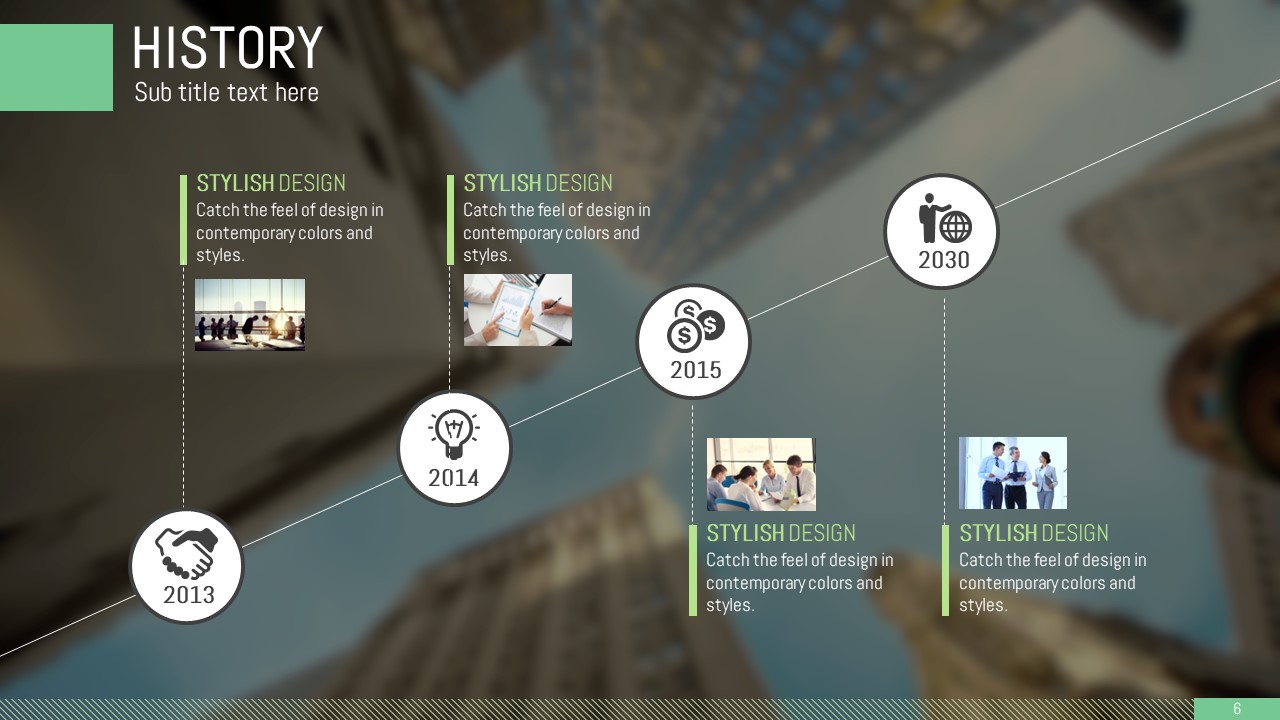
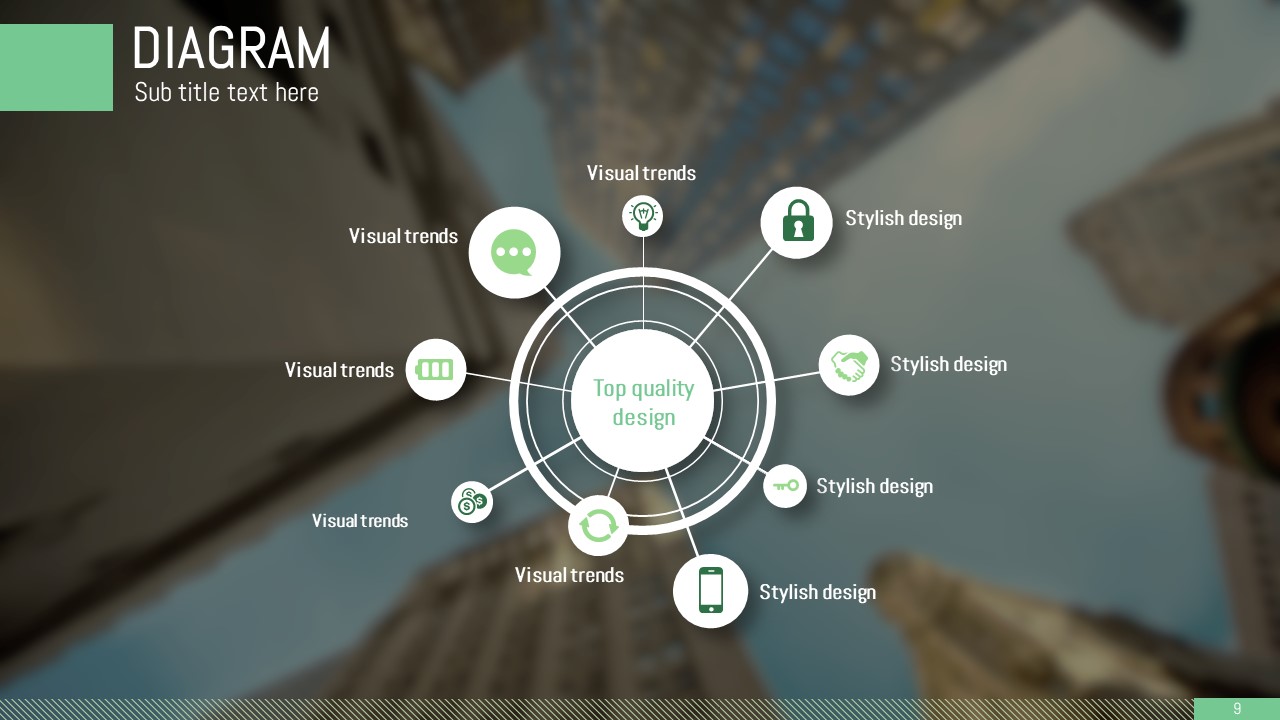
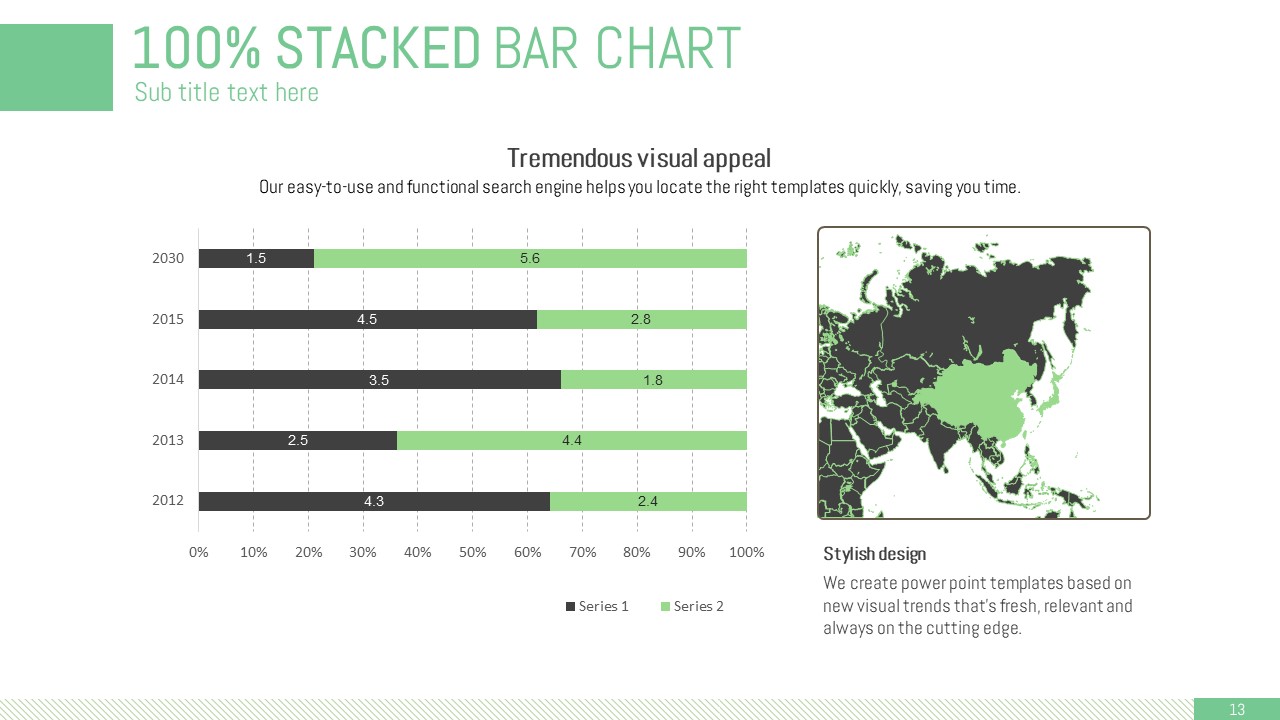
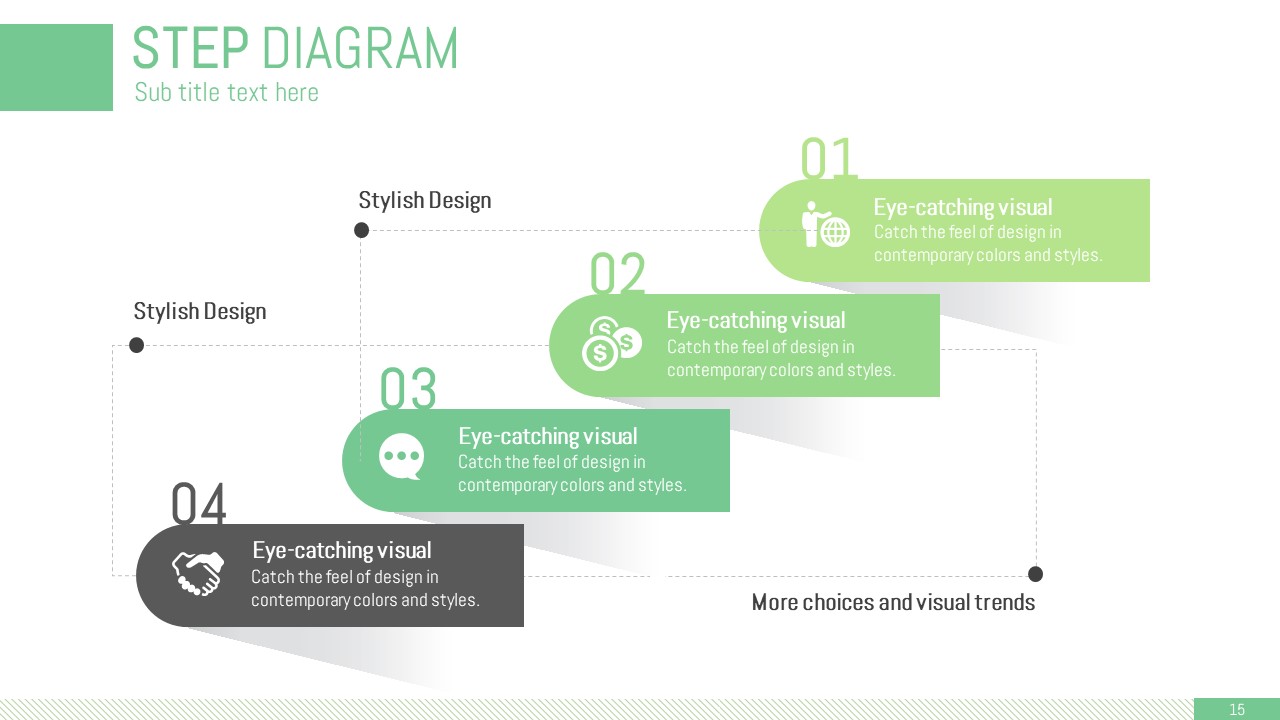
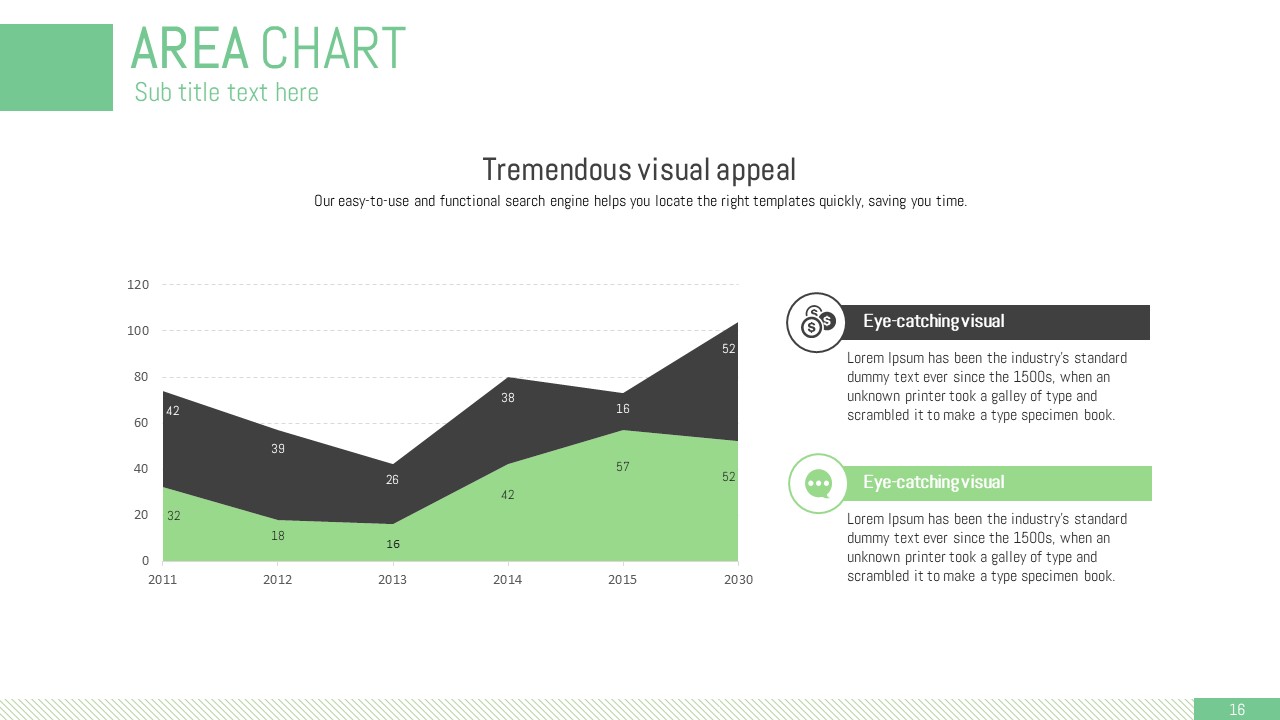
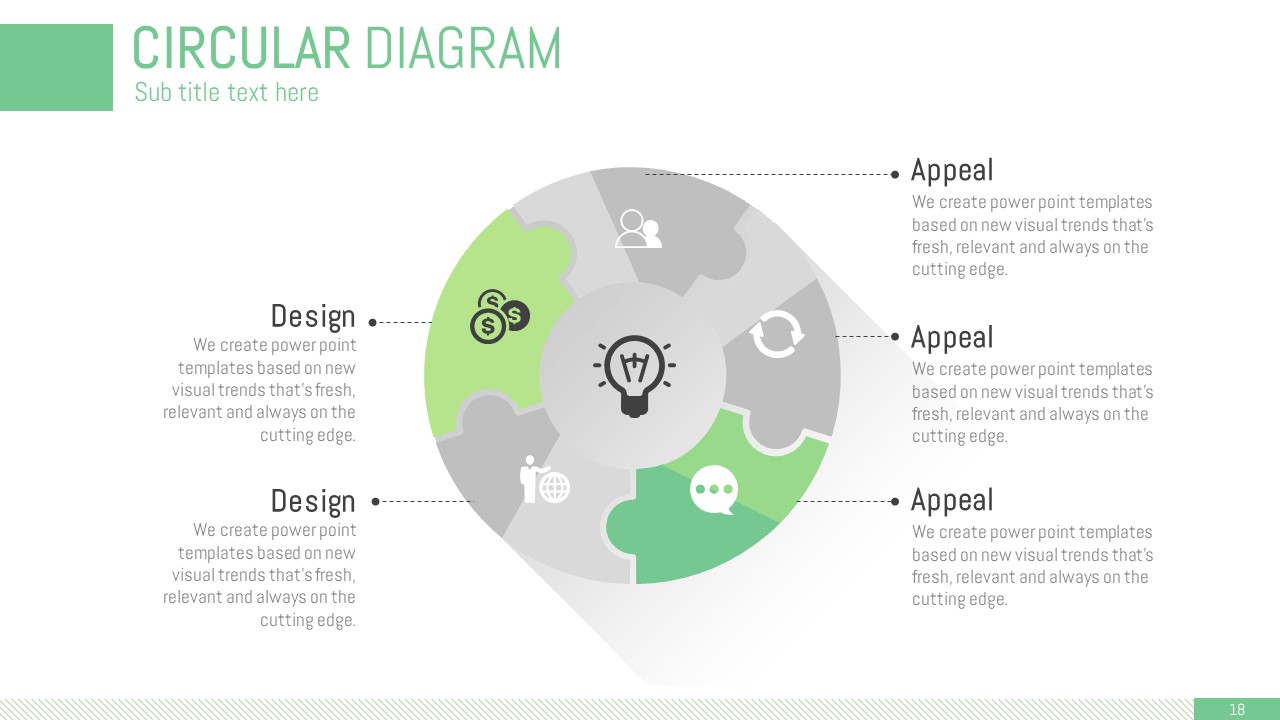
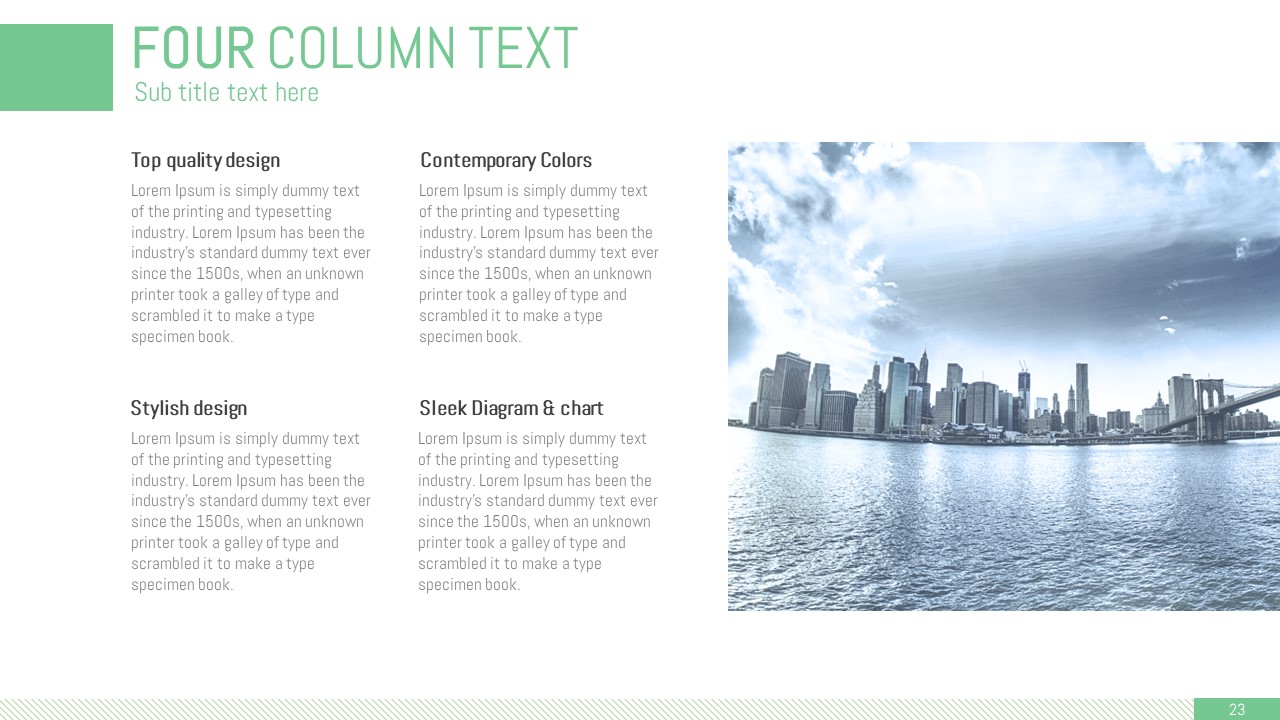
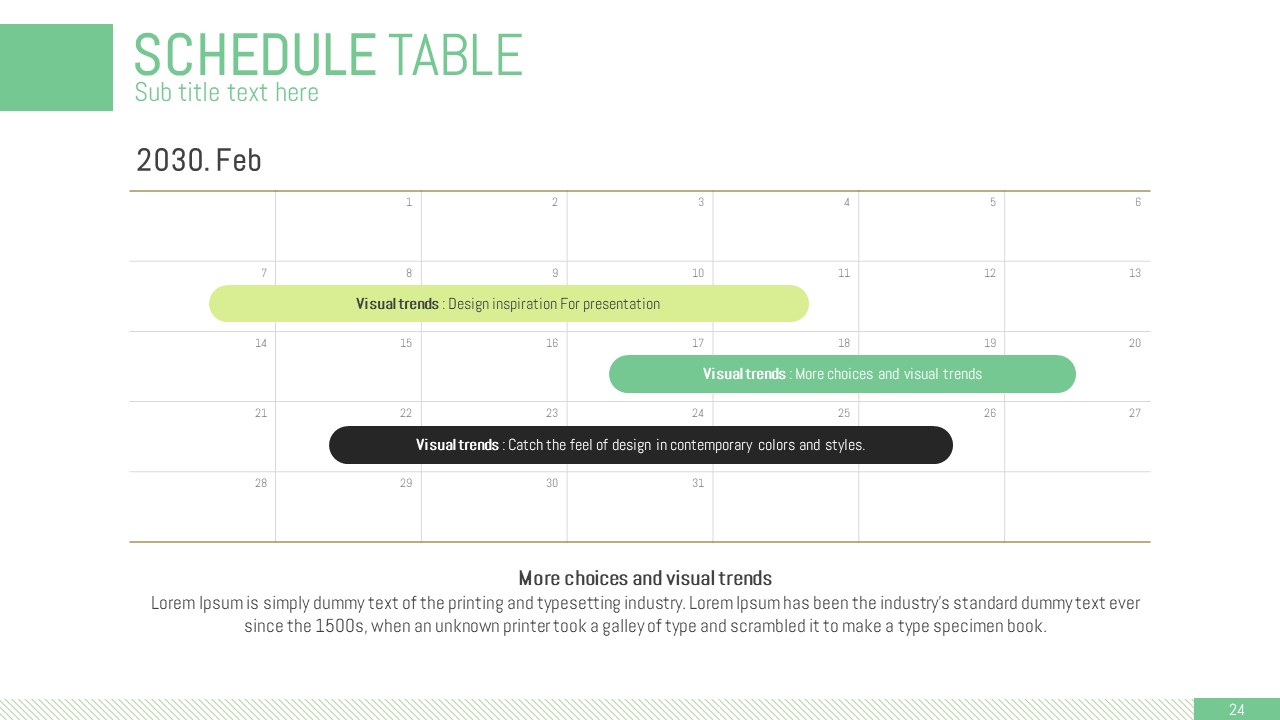
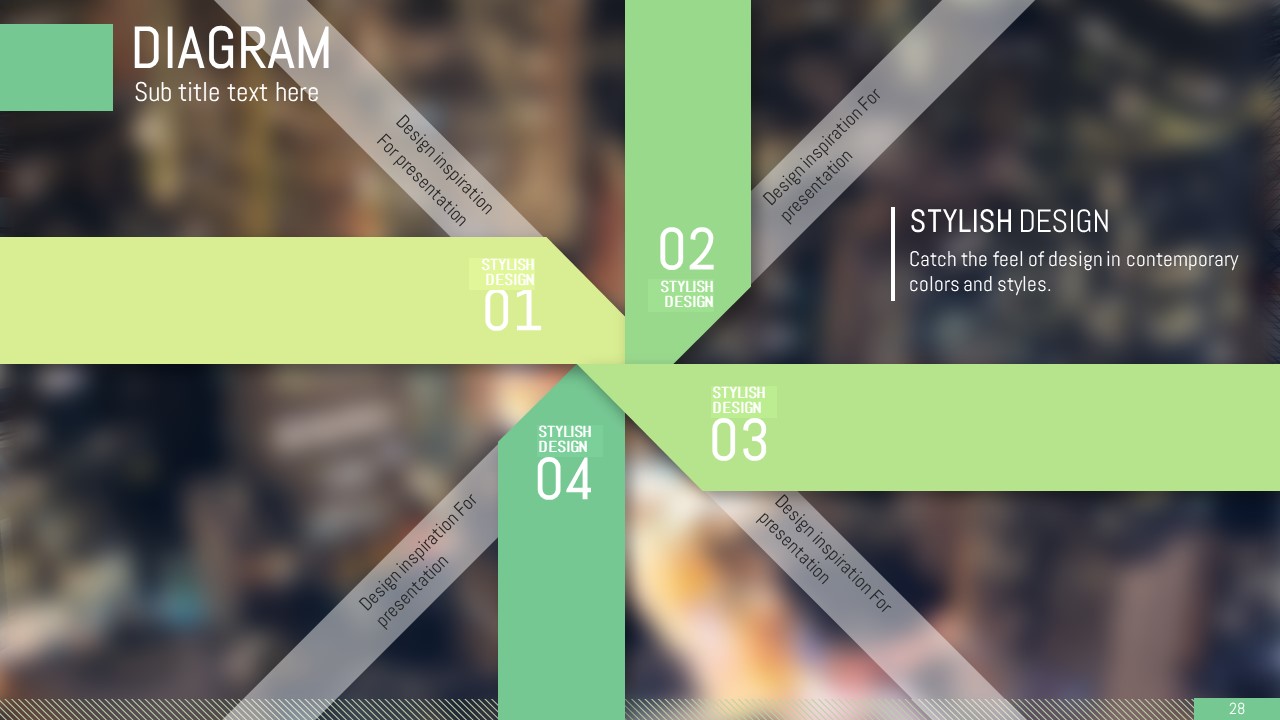
30 slides total: city skyline double-exposure cover, area chart, Venn diagram, circular process diagram, column chart, pie chart with laptop mockup, radar chart with icons, and supporting content slides with four-column grid layouts.
Related Products
-

Ideas Conference Presentation Template – Stylish Business Design
#Business
-

Office Supplies Presentation Template – Catch Attention with Wide Design
#Business
-

Business Partnership PowerPoint Template – Build Trust with Elegant Design
#Business
-

Fountain Pen Theme Presentation – Elegant Business Slide Design
#Business
