Green Yellow Data Analysis Chart – Market and Competitive Analysis
RJ0300065_28
- Last Update 05/06/2025
- File Size 0.1MB
- # of Slides 2
- File Format PPTX
- Slide Ratio 16:9
- Color
Keywords
- #Content-Based Slides
- #Design-Based Slides
- #Business Introduction
- #Market and Competitor Analysis
- #Diagram
- #Graph
- #Technological Status
- #Market Analysis
- #Table
- #Circles
- #Standard Table
- #Pie Chart
- #16:9
- #pie chart PowerPoint slide
- #circular graph template
- #data analysis chart
- #market analysis presentation
- #4-segment pie chart
- #ratio visualization slide
About the Product
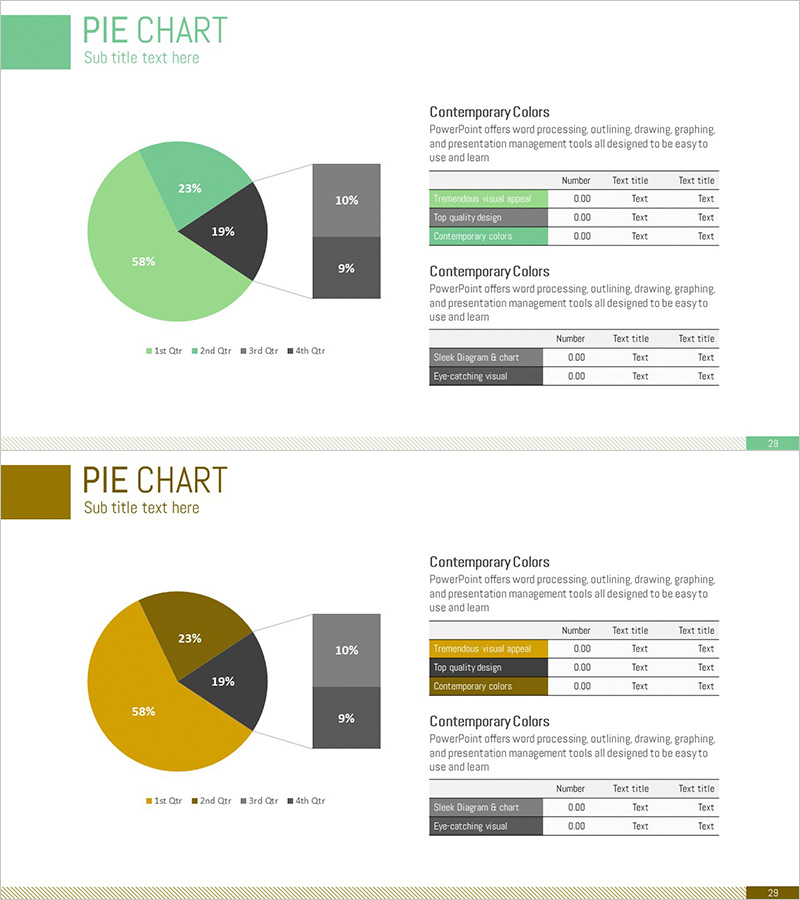
A professional pie chart PowerPoint slide optimized for market analysis and competitive landscape presentations. The two-color design combines green and yellow tones to create a 4-segment circular graph that intuitively displays data proportions, while the accompanying data table on the right provides detailed numerical information. The 2-slide set includes identical layouts in complementary color schemes (green-yellow and yellow-brown), ensuring visual consistency across your presentation while offering design flexibility. Fully editable PPTX format ready for immediate customization.
Usage Points
-
Main Usage
Visualizes proportional data across four categories such as market share, customer demographics, revenue distribution, or competitive positioning. The accompanying data table reinforces quantitative credibility by displaying exact figures and descriptions alongside the visual representation.
-
How to Use
Insert this slide into business introduction, market analysis, or competitive analysis sections to present key data insights. Customize the segment labels and colors to match your dataset, then populate the data table with your specific numbers. Optimized for 16:9 widescreen format.
-
Recommended For
Marketing professionals, executives, management consultants, and business strategists presenting data-driven insights. Ideal for investor pitch decks, business plan reports, market entry strategies, and any corporate presentation requiring quantitative analysis and visual data representation.
-
Slide Structure
Each slide features a left-aligned 4-segment pie chart with legend (1st Qtr, 2nd Qtr, 3rd Qtr, 4th Qtr) and a right-side data table with two sections. The table provides 3 columns (Number, Text title, Text title) and 3 rows for data entry, with color-coded category boxes for visual organization.
Related Products
-

Logistics Data by Year Pie Chart – Strategy for Competitor Analysis
#Market and Competitor Analysis #Diagram #Graph
-

Business Note Analysis Circle Graph & Table – Market and Competitive Analysis
#Market and Competitor Analysis #Diagram #Graph
-

Key Statistics Overview Slide – Market Analysis and Competitive Context
#Market and Competitor Analysis #Diagram #Graph
-

Goal Setting & Radial Graph – Intuitive Data Visualization
#Business Introduction #Market and Competitor Analysis #Diagram
