Work Progress Status Graph – Visualizing Current Project Status
RJ0300065_7
- Last Update 05/06/2025
- File Size 0.1MB
- # of Slides 2
- File Format PPTX
- Slide Ratio 16:9
- Color
Keywords
- #Content-Based Slides
- #Design-Based Slides
- #Product/Service Introduction
- #Operational Plan
- #Diagram
- #Graph
- #Development Status
- #Business Processes
- #Cluster
- #Circles
- #Chain Diagram
- #Doughnut Chart
- #16:9
- #doughnut chart PowerPoint
- #pie chart slide template
- #progress rate visualization PPT
- #project status graph
- #work progress PowerPoint slide
About the Product
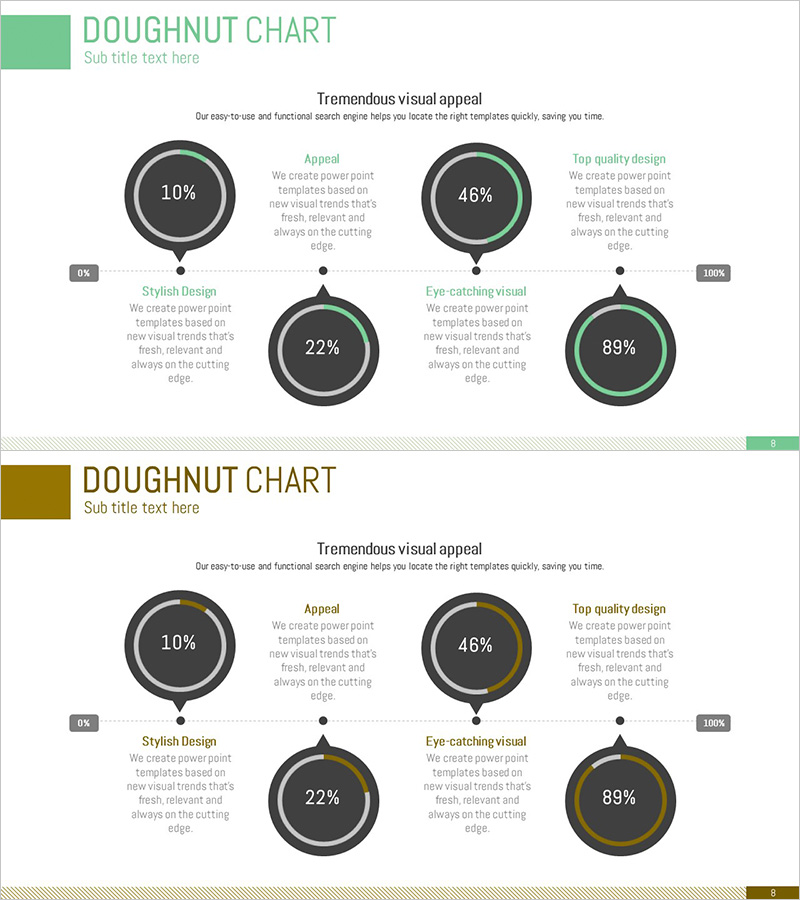
A PowerPoint slide that visualizes project progress using five doughnut-shaped charts. Each chart displays progress rates from 0% to 100%, highlighted in green and gold dual-tone colors. The top section features four key message areas including 'Appeal', 'Stylish Design', 'Eye-catching Visual', and 'Top Quality Design', while a scale bar at the bottom allows viewers to grasp overall progress at a glance. This presentation slide is ready to use immediately for various business presentations including project status monitoring, work progress reports, and performance metrics presentations.
Usage Points
-
Main Usage
Quantitatively express and compare project progress, work completion rates, and performance metrics using doughnut-shaped charts. Each chart's percentage value can be easily edited for real-time status reporting, weekly/monthly performance presentations, and team task monitoring.
-
How to Use
Double-click each doughnut chart's percentage value to change it to actual progress rates, and customize chart colors by project. Enter each item name (Appeal, Style, Visual, Quality, etc.) in the top text areas to complete the slide. Insert directly into reports, proposals, and performance presentation slides.
-
Recommended For
Project managers, team leaders, executives responsible for reporting, marketing managers, and sales administrators who need to visually communicate progress status on a weekly, monthly, or quarterly basis. Particularly suitable when comparing multiple project statuses simultaneously or quantifying performance metrics for presentation.
-
Slide Structure
Two-slide layout. First slide features five green-tone doughnut charts (10%, 46%, 22%, 89%, etc.) with descriptive text areas for each item. Second slide contains five gold-tone doughnut charts with identical structure. Each chart includes center percentage display, outer progress ring, and 0%-100% scale bar at the bottom.
Related Products
-

Development Status Analysis Connection Diagram – Effective Information Delivery
#Product/Service Introduction #Market and Competitor Analysis #Diagram
-

Status of Research and Development by Topic – Innovation and Trust
#Product/Service Introduction #Market and Competitor Analysis #Diagram
-

Business Analysis with Doughnut Chart – Dawn City Theme
#Product/Service Introduction #Business Introduction #Diagram
-

Competitive Advantage Analysis Diagram – Drive to Market Success
#Product/Service Introduction #Market and Competitor Analysis #Diagram
