Business Competitor Trend Graph – A Tool for Analyzing Competitive Advantage through Market Analysis
RJ0300065_25
- Last Update 05/06/2025
- File Size 1.5MB
- # of Slides 2
- File Format PPTX
- Slide Ratio 16:9
- Color
Keywords
- #Content-Based Slides
- #Design-Based Slides
- #Market and Competitor Analysis
- #Graph
- #Competitor Analysis
- #Competitive Advantage
- #Line
- #Line Chart
- #16:9
- #line chart PowerPoint
- #competitor analysis slide
- #market trend template
- #3-series graph design
- #business data visualization PowerPoint
- #how to create trend analysis in PowerPoint
About the Product
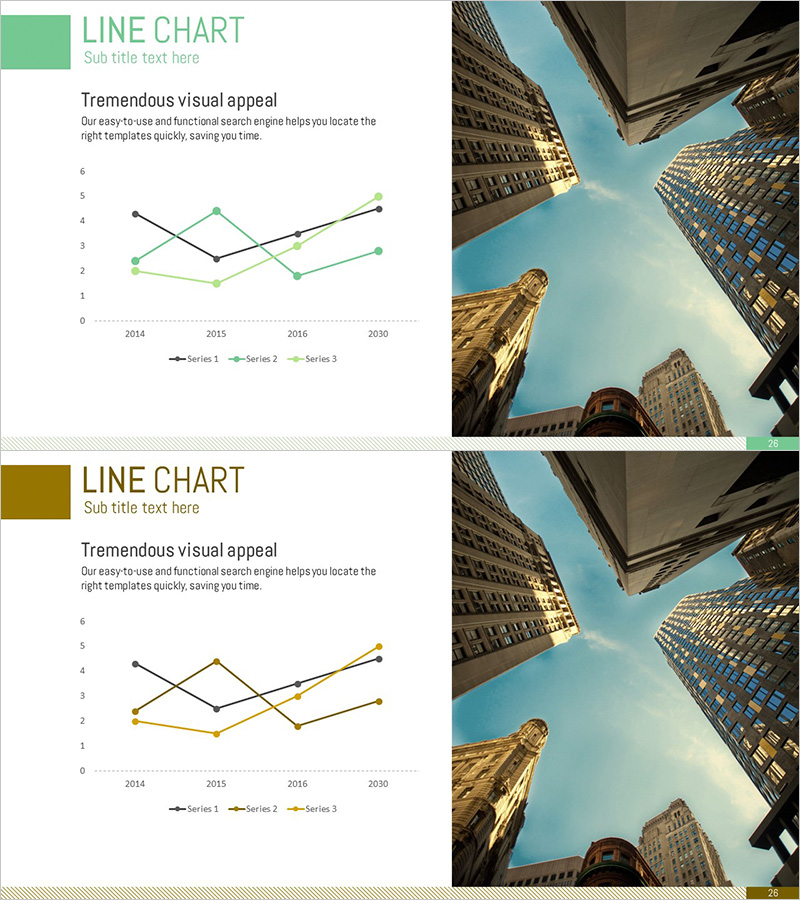
A 3-series line chart PowerPoint slide designed to visualize competitor dynamics and market shifts from 2014 to 2030. This presentation template uses mint green, black, and olive-toned lines that intersect across four data points, clearly communicating changes in competitive positioning. The 2-slide set in 16:9 widescreen format includes full-color background imagery, making it ready for professional market analysis reports, business presentations, and strategic planning decks. Each line represents a different competitor metric, enabling side-by-side trend comparison for executive briefings and investor presentations.
Usage Points
-
Main Usage
Ideal for comparing competitor performance metrics, market share evolution, and revenue trends across multiple time periods. Enables quantitative demonstration of competitive advantage shifts in executive reports, investor presentations, and strategic planning sessions.
-
How to Use
Input your actual data into the provided line chart framework. Edit line colors, thickness, and styling using PowerPoint's native tools. Customize axis labels, legend entries, and title text to match your organization's context and data.
-
Recommended For
Marketing managers, strategy planners, executives, consultants, and business analysts preparing competitive landscape analysis. Suitable for business plans, quarterly performance reports, market analysis documents, and investor pitch decks—particularly the market analysis and competitive positioning sections.
-
Slide Structure
2-slide set featuring 3-series line chart with mint green, black, and olive lines intersecting at four data points (2014, 2015, 2016, 2030). Y-axis ranges 0–6, includes 3-item legend, title and subtitle areas, and cityscape photography on the right side to reinforce business context.
Related Products
-

Market Competitiveness Comparison Graph – Highlighting Competitive Advantage
#Market and Competitor Analysis #Graph #Competitor Analysis
-

Competitor Comparison Analysis Graph - Highlighting Competitive Advantage
#Market and Competitor Analysis #Graph #Competitor Analysis
-

Default Line Graph for Market & Competitor Analysis – Competitive Advantage
#Market and Competitor Analysis #Graph #Competitor Analysis
-

Competitor Idea Analysis Graph
#Market and Competitor Analysis #Graph #Competitor Analysis
