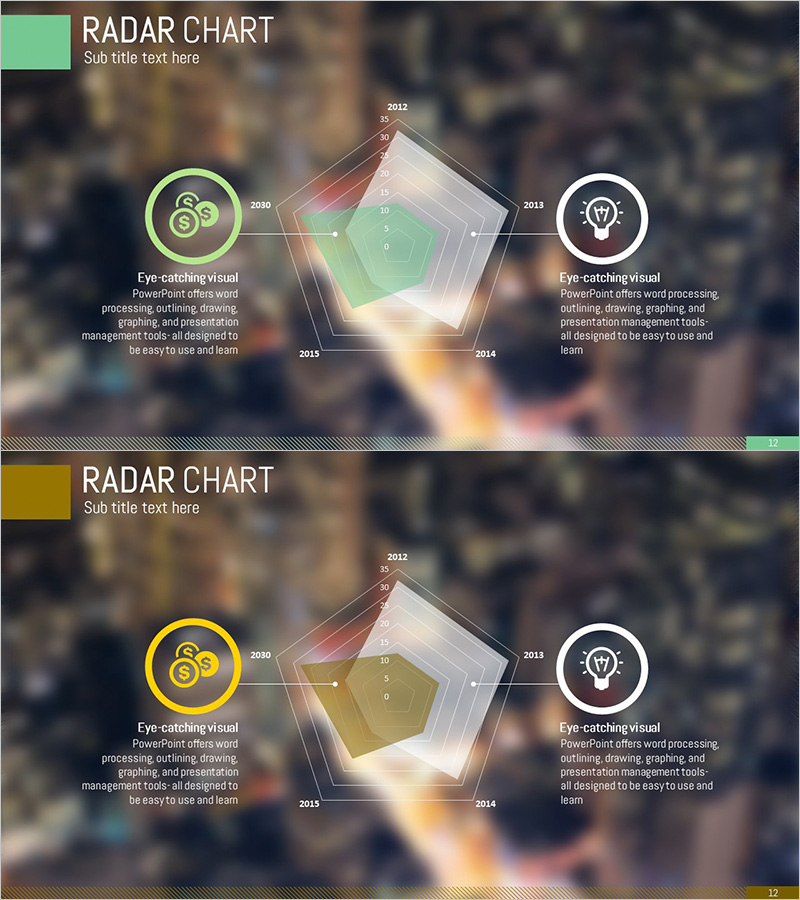
Technology Status Pentagon Area Diagram
RJ0300065_11
- Last Update 05/06/2025
- File Size 1.2MB
- # of Slides 2
- File Format PPTX
- Slide Ratio 16:9
- Color
Keywords
- #Content-Based Slides
- #Design-Based Slides
- #Product/Service Introduction
- #Business Introduction
- #Graph
- #Other
- #Development Plan
- #Technological Status
- #Horizontal Bar
- #Segmented Horizontal Bar
- #Map
- #16:9
- #radial diagram PowerPoint
- #pentagon chart slide
- #5-axis analysis template
- #technology status diagram
- #radial graph PowerPoint slide
About the Product
A radial pentagon diagram PowerPoint slide that visualizes technology status across five key axes in a single view. The design features a central hub with five directional extensions, ideal for comparing product specifications, competitive advantages, market positioning, and development roadmaps. The mint-green and gold dual-tone background with overlapping transparent pentagon areas creates an intuitive data comparison effect. Left and right circular icons with text areas allow for detailed explanations. This 2-slide presentation template is ready to use for technology briefings, product introductions, and business analysis presentations.
Usage Points
-
Main Usage
Compares five key metrics such as product specifications, competitive strengths, market positioning, and development roadmaps across multiple dimensions. The radial structure extending from a central hub simultaneously visualizes strengths and weaknesses of each axis, making it effective for decision-making presentations.
-
How to Use
Enter technology category names (e.g., Performance, Stability, Cost, Scalability, Usability) on each pentagon axis and represent values or ratings through area size. Add detailed explanations in the left and right icon areas and text boxes to customize for your presentation context.
-
Recommended For
Recommended for product development teams, technology planners, business managers, and investment pitch presenters explaining technology status, competitive analysis, and product positioning. Ideal for technology seminars, product introduction presentations, and business planning reports requiring multi-metric comparisons.
-
Slide Structure
2-slide layout with a pentagon diagram featuring five axes on each slide. Transparent overlapping pentagon areas extend from the center in five directions, with circular icons and text boxes symmetrically positioned on left and right for balanced visual composition.
Related Products
-

US Target Market Analysis Graph – Understanding Market Segmentation
#Market and Competitor Analysis #Marketing Plan and Strategy #Graph
-

Target Country Analysis Chart – Data Visualization for Market Analysis
#Market and Competitor Analysis #Graph #Other
-

Asia Target Market Analysis Graph – Tremendous Visual Appeal
#Market and Competitor Analysis #Graph #Other
-

Visualizing Current Internet Shopping Payment Technologies with Horizontal Bar Graph
#Business Introduction #Market and Competitor Analysis #Graph
