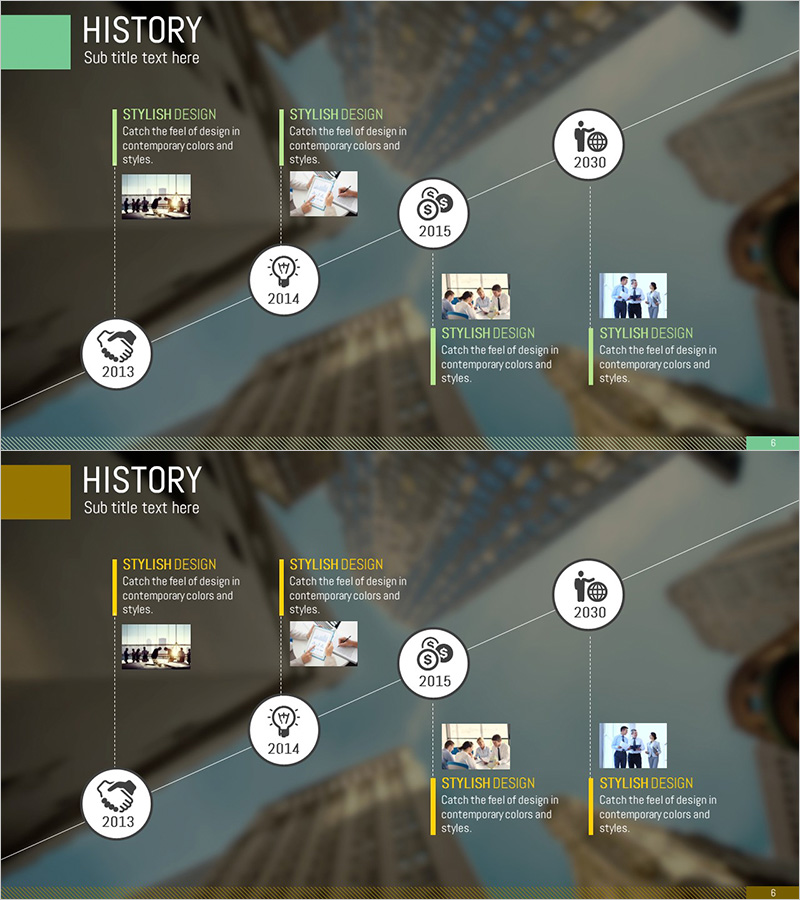
Business History Diagram – Cluster Visualization
RJ0300065_5
- Last Update 05/06/2025
- File Size 3.3MB
- # of Slides 2
- File Format PPTX
- Slide Ratio 16:9
- Color
Keywords
About the Product
A professional PowerPoint slide featuring a 5-node cluster diagram visualizing company history from 2013 to 2030. The design arranges circular nodes along a central timeline with year labels and icons, complemented by image placeholders and descriptive text boxes on each side. Available in mint green and gold header bar color options with semi-transparent background overlay for a polished, corporate appearance. This presentation slide effectively communicates business milestones, growth phases, and key achievements in a visually compelling format suitable for investor presentations and corporate communications.
Usage Points
-
Main Usage
Visualizes a company's development journey from founding to present using a timeline-based cluster structure. The 5-node layout accommodates year labels, icons, images, and descriptions to tell your company's story clearly and memorably. Ideal for investor pitches, corporate introductions, annual reports, and presentations emphasizing organizational credibility and growth trajectory.
-
How to Use
Replace each node's year with your actual milestones and swap icons to represent key events from that period. Update the adjacent text boxes with achievements, product launches, expansion milestones, or organizational growth. Customize background images with company office photos, product images, or team pictures to reinforce brand identity and visual consistency.
-
Recommended For
Executives, marketing teams, and communications professionals presenting company history and growth. Suitable for new employee onboarding, investor pitches, partnership proposals, press briefings, and corporate announcements. Particularly effective for startups showcasing growth stories or established companies announcing rebranding initiatives.
-
Slide Structure
2-slide set with color variations: mint green header bar on slide 1, gold header bar on slide 2. Each slide features a left-to-right flowing timeline with 5 circular nodes positioned at key years. Image placeholders and text boxes flank each node for balanced information layout. 16:9 widescreen format optimized for modern presentation environments and digital displays.
Related Products
-

Introduction to the History of the Architectural Company – A Visual Timeline
#Company Introduction #Diagram #Company Overview
-

Business History Connection Diagram
#Company Introduction #Diagram #History
-

Fountain Pen History Diagram – Emphasizing Corporate Identity
#Company Introduction #Product/Service Introduction #Diagram
-

Silhouette History Diagram – Visualizing Evolution
#Company Introduction #Diagram #Other
