Data Status Analysis Pie Chart – Intuitive Visualization
RJ0300065_24
- Last Update 05/06/2025
- File Size 0.8MB
- # of Slides 2
- File Format PPTX
- Slide Ratio 16:9
- Color
Keywords
About the Product
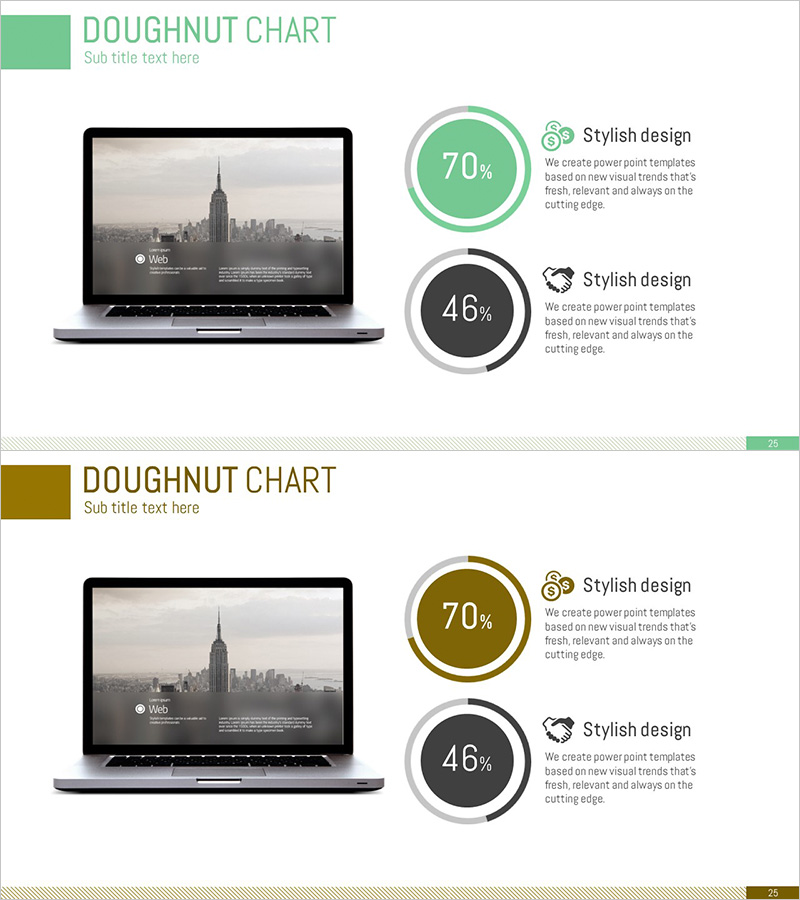
A doughnut chart PowerPoint slide that intuitively expresses data status and comparative analysis. This presentation template features two doughnut-shaped pie charts in green and black tones, clearly visualizing different data ratios (70% and 46%). The slide includes a laptop mockup image on the left, providing a realistic preview of the presentation environment, with icons and descriptive text positioned next to each chart to emphasize data meaning. This PPT slide is ready to use for business reports, performance analysis, and market research presentations.
Usage Points
-
Main Usage
This visualization slide is designed for data status analysis and ratio comparison. The doughnut chart intuitively conveys the proportion of parts relative to the whole, and positioning two charts side by side enables simultaneous comparison of different datasets. It is particularly effective for expressing ratio-based data such as performance analysis, customer satisfaction surveys, and market share.
-
How to Use
The slide positions two doughnut charts on the right side of the laptop mockup, with icons and descriptive text placed next to each chart to emphasize data meaning. Edit the chart percentages (70%, 46%) and colors (green, black) to match your data, and replace the text descriptions with specific category names. This template can be directly inserted into business reports, marketing plans, and investor presentation slides.
-
Recommended For
Ideal for data analysts, marketing planners, business executives, consultants, and educators. This template is particularly useful when presenting quantitative data in a visually compelling manner, and can be applied to business presentations, academic talks, and internal meeting materials.
-
Slide Structure
The slide is formatted in 16:9 widescreen with a laptop mockup image positioned on the left and two doughnut charts vertically aligned on the right. Each chart consists of an outer and inner ring in doughnut form, with the top chart highlighted in green (70%) and the bottom in black (46%). Icons and 'Stylish design' text are positioned next to each chart to complement the data explanation.
Related Products
-

Data Analysis Status Pie Chart – A Tool for Clear Understanding
#Product/Service Introduction #Graph #Other
-

Technology Achievement Donut Chart
#Product/Service Introduction #Business Introduction #Graph
-

Online Business Marketing Strategy – Data-Driven Decision Making
#Product/Service Introduction #Marketing Plan and Strategy #Graph
-

Plastic Surgery Data Analysis Donut Pie Chart Slide
#Product/Service Introduction #Graph #Other
