Sales and Profit Analysis Chart – An Effective Tool for Financial Performance
RJ0300065_29
- Last Update 05/06/2025
- File Size 0.3MB
- # of Slides 2
- File Format PPTX
- Slide Ratio 16:9
- Color
Keywords
About the Product
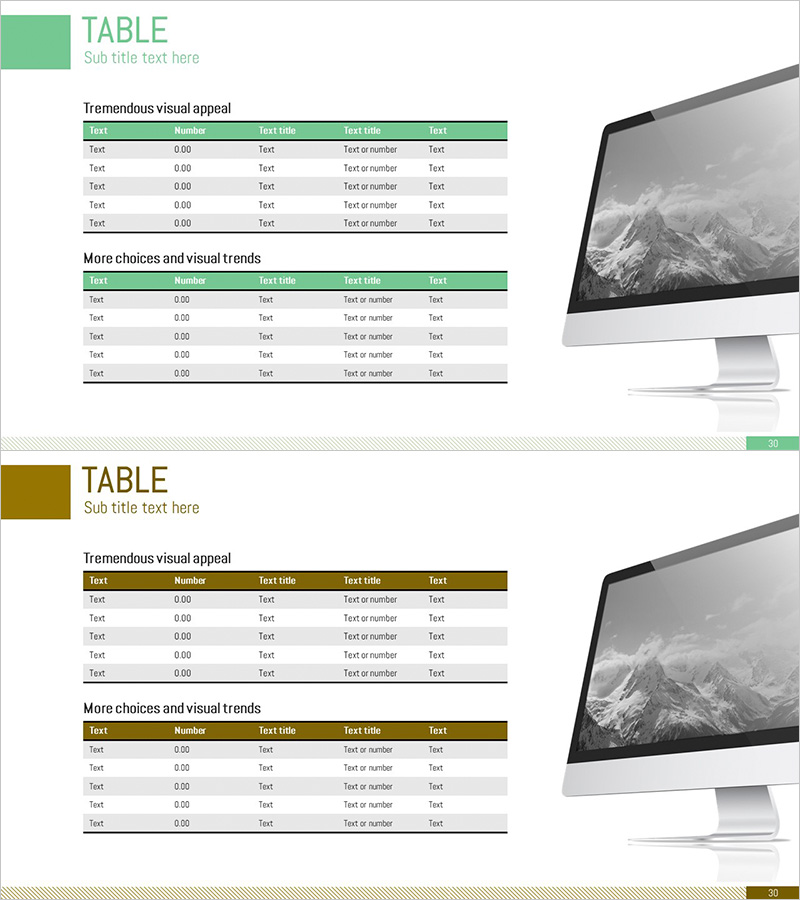
A 2-slide PowerPoint presentation featuring data tables designed for sales and profit analysis. Available in two color versions with green and olive accent headers, each slide includes 5 columns (Text, Number, Text title, Text title, Text) and 5 rows for data entry. Perfect for organizing financial performance, revenue tracking, and cost analysis information with clear structure and professional appearance. Delivered in 16:9 widescreen PPTX format, fully editable and ready to integrate into presentations and reports.
Usage Points
-
Main Usage
Visualize financial data, sales figures, and cost information in a structured table format. The 5-column, 5-row layout is optimized for comparing metrics across categories and analyzing trends, providing credible data representation for business reports and presentations.
-
How to Use
Enter item names, numerical values, and descriptions in each cell to display quarterly sales, departmental budgets, or financial performance metrics. The green header row and alternating white-gray data rows enhance readability. Choose between color versions to match your presentation theme and corporate branding.
-
Recommended For
Finance teams, executives, and sales managers presenting quarterly results, budget status, and cost analysis. Ideal for business plans, performance reports, investor presentations, and management meetings where data-driven decision-making is essential.
-
Slide Structure
2-slide set with title area and 5-column (Text, Number, Text title, Text title, Text) by 5-row data entry grid on each slide. Headers feature green or olive background with white text; data rows alternate between white and light gray for visual distinction and improved scanning.
Related Products
-

Sales and Profit Table – Clear Visualization of Financial Planning
#Financial Plans and Performance #Diagram #Other
-

Business Income Statement Slide - Highlighting Financial Performance
#Financial Plans and Performance #Diagram #Income Statement
-

Income Statement Results Table - Visualizing Financial Performance
#Financial Plans and Performance #Diagram #Income Statement
-

Illustration Theme Income Statement Table – A Fresh Perspective on Financial Data
#Financial Plans and Performance #Diagram #Income Statement
