Global User Analysis Map Graph
RJ0300065_19
- Last Update 05/06/2025
- File Size 0.6MB
- # of Slides 2
- File Format PPTX
- Slide Ratio 16:9
- Color
Keywords
- #Content-Based Slides
- #Design-Based Slides
- #Company Introduction
- #Market and Competitor Analysis
- #Graph
- #Other
- #Global Network
- #Customer Analysis
- #Other
- #Other Charts
- #Map
- #16:9
- #world map PowerPoint slide
- #global user analysis presentation
- #map graph template
- #international market analysis slides
- #location marker map slide download
About the Product
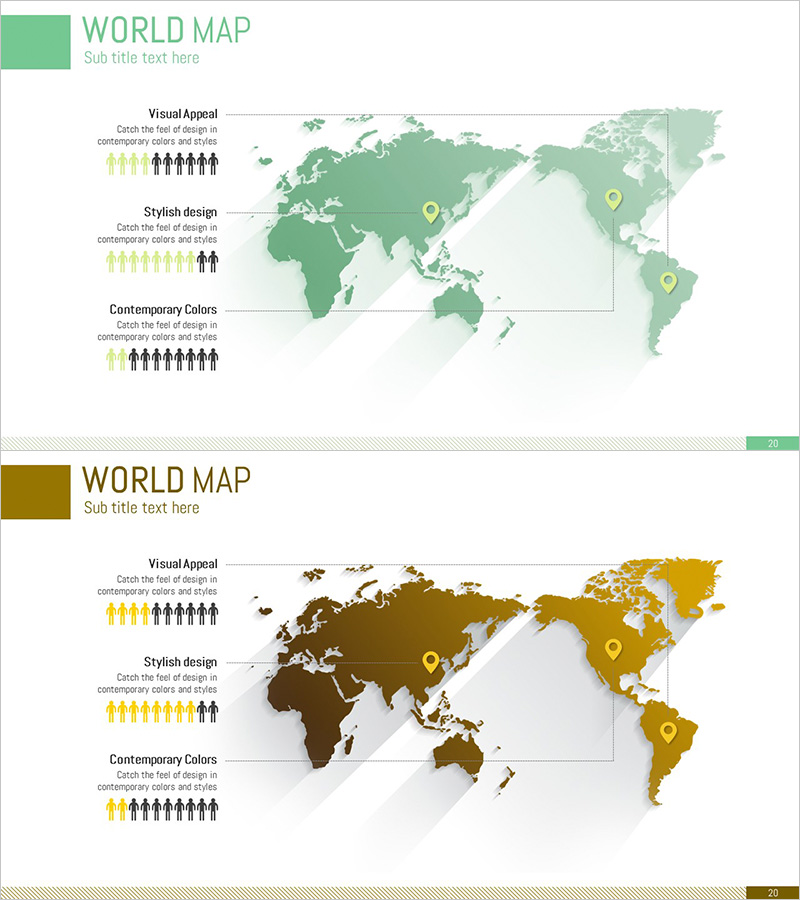
A world map PowerPoint slide designed for global market expansion and international user analysis presentations. Available in two color versions—mint green and olive brown—each slide features a world map with location marker pins to visually represent user distribution, market penetration status, and customer concentration across regions. The left side includes text areas and icon groups explaining visual appeal, stylish design, and contemporary color combinations, enabling systematic presentation structure. Delivered as a 2-slide 16:9 widescreen set ready for immediate use, this is an essential map-based data visualization tool for global business presentations.
Usage Points
-
Main Usage
Visualize international business strategy, global market expansion plans, and multi-country user distribution analysis using map-based representation. Location markers enable quick identification of regional user concentration, market opportunities, and competitive positioning, making it highly effective for investor pitches and executive briefings.
-
How to Use
Adjust marker positions on the slide to match your actual data, then populate the left text area with regional user counts, revenue figures, or growth rates. Select the color version that aligns with your corporate brand guidelines, and add supplementary markers or emphasis zones to create a customized analysis presentation.
-
Recommended For
Global marketing managers, international business development teams, investor relations professionals, market research analysts, and multinational company executives. Particularly valuable for overseas expansion planning, global customer segmentation, and international partnership proposals.
-
Slide Structure
2-slide set. Each slide displays a full world map background with 3–5 location marker pins positioned across major regions (Asia, Europe, Americas). The left side contains 3 text sections (visual appeal, stylish design, contemporary colors) with accompanying icon groups arranged vertically. Slide numbers appear at the bottom of each slide.
Related Products
-

Data Visualization Slide Template Featuring World Map
#Market and Competitor Analysis #Graph #Other
-

Premium Management Presentation Map Analysis3 - Customer Insights and Market Analysis
#Market and Competitor Analysis #Graph #Other
-

Dot Map Analysis Graph – Global Network and Target Market
#Company Introduction #Market and Competitor Analysis #Graph
-

Analysis of Global User Distribution – Data Visualization and Trends
#Company Introduction #Market and Competitor Analysis #Other
