Market Distribution Comparison Graph – Trends and Analysis
RJ0300065_15
- Last Update 05/06/2025
- File Size 0.8MB
- # of Slides 2
- File Format PPTX
- Slide Ratio 16:9
- Color
Keywords
- #Content-Based Slides
- #Design-Based Slides
- #Market and Competitor Analysis
- #Diagram
- #Graph
- #Competitor Analysis
- #Market Analysis
- #Cluster
- #Other
- #Chain Diagram
- #Area Chart
- #16:9
- #area chart PowerPoint
- #area graph slide template
- #trend comparison presentation
- #market distribution chart
- #2-series area chart
- #market analysis slides
- #how to create area chart in PowerPoint
About the Product
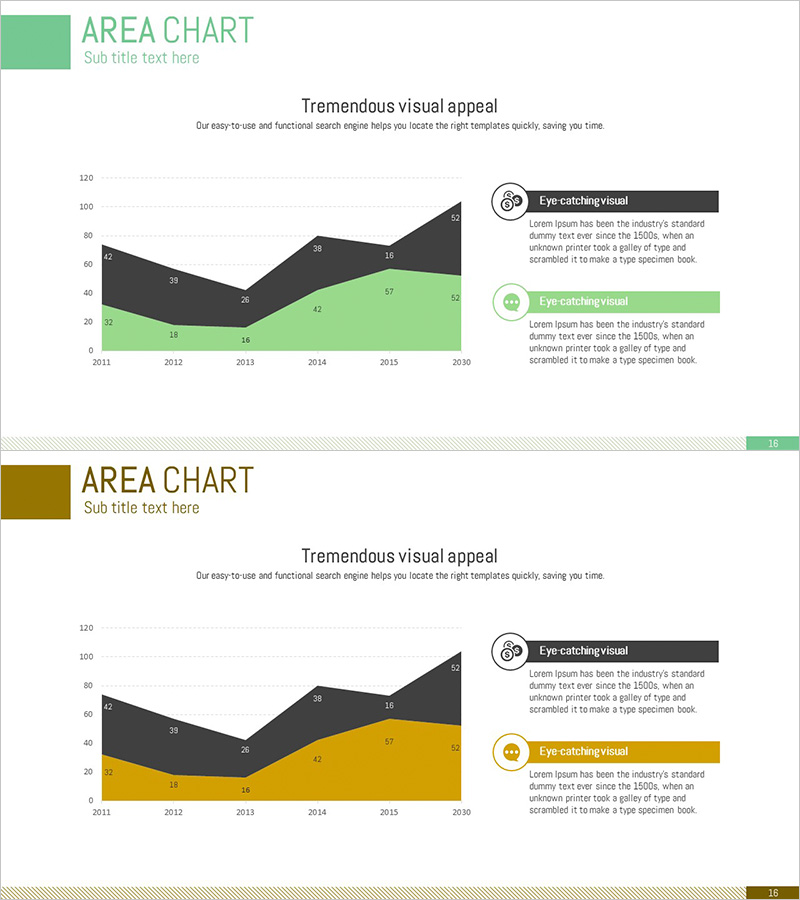
An area chart PowerPoint slide designed to visualize market distribution and trend changes over time. Composed of two data series in mint green and charcoal gray, it clearly represents market share evolution from 2011 to 2030. Numerical values are displayed within each area, making it immediately applicable for presentations requiring comparative analysis such as market penetration, competitive benchmarking, and revenue trends. The 2-slide set offers multiple color combinations (mint & charcoal / olive & charcoal) that can be customized to match your corporate brand colors.
Usage Points
-
Main Usage
Ideal for visualizing market distribution trends, competitive market share changes, and revenue composition comparisons across two or more data series over time. The distinct area boundaries enable simultaneous observation of individual series trends and overall magnitude changes.
-
How to Use
Replace the displayed numerical values with your own data and update the legend text accordingly. Colors can be adjusted to match your corporate brand palette, and axis labels (years/categories) and legend positioning are fully customizable.
-
Recommended For
Executive reports, business performance presentations, market analysis materials, investor relations meetings, and marketing strategy sessions. Particularly effective when emphasizing temporal trends and changes in data-driven decision-making contexts.
-
Slide Structure
2-slide set. Each slide features a 2-series area chart with X-axis representing years (2011–2030) and Y-axis showing numerical values (0–120). Data points are marked within each area, with legend and descriptive text positioned on the right side of the chart.
Related Products
-

Fintech Market Analysis Bar Graph – Clear Data Visualization
#Market and Competitor Analysis #Diagram #Graph
-

Gradient Theme Area Diagram – Market and Competitor Analysis
#Market and Competitor Analysis #Diagram #Graph
-

Data Analysis Graph Visualization for Market Competition
#Market and Competitor Analysis #Diagram #Graph
-

Competitor Analysis Graphs & Tables – Delivering Market Insights
#Market and Competitor Analysis #Diagram #Graph
