Business Transaction Steps Procedure Visualization Diagram
RJ0300065_14
- Last Update 05/06/2025
- File Size 0.2MB
- # of Slides 2
- File Format PPTX
- Slide Ratio 16:9
- Color
Keywords
- #Content-Based Slides
- #Design-Based Slides
- #Business Strategy
- #Business Management
- #Diagram
- #Step-by-Step Schedule Plan
- #Implementation Schedule
- #Structure
- #Pyramid Chart
- #16:9
- #4-step diagram PowerPoint
- #business transaction process slide
- #flow diagram template
- #step-by-step process PPT
- #transaction visualization
- #how to create process diagram in PowerPoint
About the Product
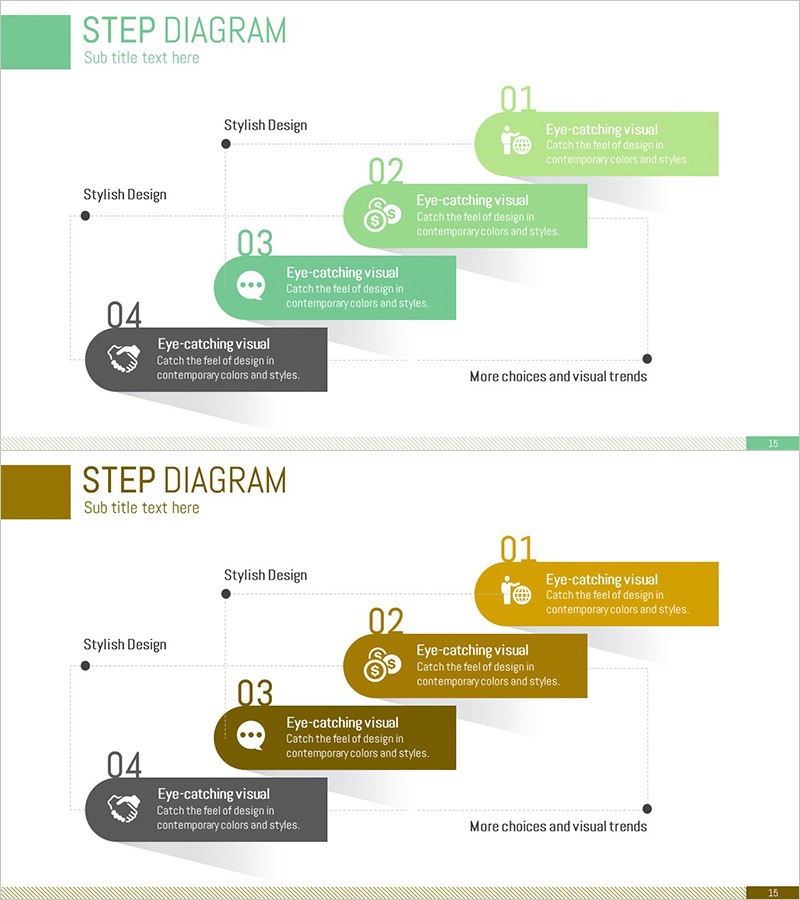
A 4-step flow diagram PowerPoint slide that visualizes business transaction stages and procedures with a two-tone gradient from green to gold. Each step features an icon and descriptive text box, with left-side dots and right-side arrow connectors emphasizing the sequential flow. The final step uses a darker tone to indicate completion. Delivered in 2-slide 16:9 PPTX format, fully editable and ready for immediate use in business strategy presentations, transaction process explanations, decision-making frameworks, and corporate communications.
Usage Points
-
Main Usage
Clearly visualize business transaction processes, project phases, decision-making procedures, and transaction workflows in four distinct steps. The color gradient progression intuitively communicates sequential advancement and stage completion to audiences.
-
How to Use
Customize each step's text box with specific transaction details, responsible parties, and timelines. Icons and colors are fully editable to match your company branding and transaction types. Suitable for business briefings, investor meetings, internal status reports, and process training sessions.
-
Recommended For
Business managers, sales directors, project managers, consultants, financial officers, and process improvement specialists. Ideal for explaining transaction workflows, responsibility distribution across stages, progress tracking, and decision-making procedures in corporate settings.
-
Slide Structure
Four-node structure with left-side dot indicators and right-side arrow connectors. Each node combines a circular icon (approximately 40px diameter) with a rectangular text box (approximately 200px × 80px) positioned to the right. Color progression: green → light green → gold → dark gray across steps. Two-slide set with color variation options.
Related Products
-

Progress and Phase of Implementation – Diagram Design
#Business Strategy #Business Management #Diagram
-

Financial Services Step-by-Step Schedule - A Guide for Systematic Execution
#Business Strategy #Business Management #Diagram
-

3 Step Delivery Process – Efficiency in Logistics Management
#Business Strategy #Business Management #Diagram
-

Origami Presentation Template Flow Sequence Diagram – Business Strategy
#Business Strategy #Business Management #Diagram
