Target Market Analysis Data Table - Market Growth Statistics
RJ0300065_12
- Last Update 05/06/2025
- File Size 0.6MB
- # of Slides 2
- File Format PPTX
- Slide Ratio 16:9
- Color
Keywords
- #Content-Based Slides
- #Design-Based Slides
- #Market and Competitor Analysis
- #Graph
- #Other
- #Market Analysis
- #Target Market
- #Horizontal Bar
- #Segmented Horizontal Bar
- #Map
- #16:9
- #stacked horizontal bar chart PowerPoint
- #time series data visualization slide
- #100% stacked chart template
- #market analysis graph PowerPoint
- #comparative ratio chart slide template
About the Product
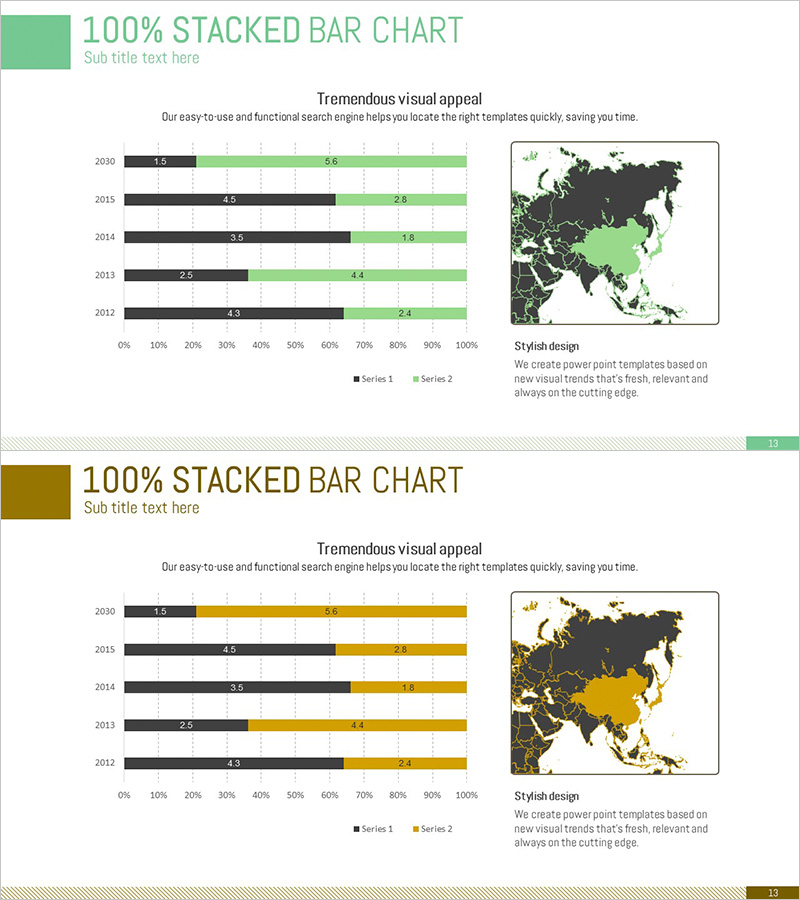
A 2-slide PowerPoint presentation featuring 100% stacked horizontal bar charts for time-series data visualization. The slides display data from 2012 to 2030 across two data series (black and green, or black and gold), enabling clear comparison of proportional changes over time. Each slide includes a world map on the right side to contextualize regional market growth. The stacked bar structure makes ratio relationships immediately apparent, making it ideal for market analysis presentations, business performance reports, and investment pitch decks. All elements are fully editable and ready for immediate use.
Usage Points
-
Main Usage
Visualize market growth data and compositional changes across years and regions using stacked bar percentages. Track relative proportion shifts between two data series and simultaneously display global market context through integrated world map visualization.
-
How to Use
Insert into market analysis sections of business reports, performance review presentations, and investor pitch decks. Input annual data values and the chart automatically calculates proportions. Customize colors and legend labels to match corporate branding guidelines. All chart elements remain fully editable.
-
Recommended For
Marketing managers, business analysts, strategists, and executives presenting market trends and growth metrics. Particularly effective for multinational companies comparing regional growth rates, product category market share evolution, and year-over-year revenue composition changes.
-
Slide Structure
Each slide contains a title area, six stacked horizontal bars (2012–2030), horizontal axis (0–100%), legend (Series 1 and Series 2), and a world map visualization panel on the right. Two color schemes available: green or gold accent with black base. All components are editable.
Related Products
-

Target Country Year-by-Year Analysis Chart – Data Visualization for Market Analysis
#Market and Competitor Analysis #Graph #Other
-

US Target Region Analysis Graph – Visualizing Market Status
#Market and Competitor Analysis #Graph #Other
-

Asia Target Market Analysis Graph – Tremendous Visual Appeal
#Market and Competitor Analysis #Graph #Other
-

Gauge Charts by Region – Market Analysis and Competitiveness
#Market and Competitor Analysis #Graph #Other
